InsightsBeyond Consensus: Building a Systematic Investment House View Tracker
Beyond Consensus: Building a Systematic Investment House View Tracker
See how CountryRisk.io turns scattered market outlooks into a continuously updated house-view tracker.
Bernhard Obenhuber Aug 25, 2026
In financial markets, following the consensus rarely produces above-consensus returns—especially after accounting for the cost of running an investment strategy team.
The challenge is particularly acute in large, liquid asset classes. Information travels quickly, widely followed data is reflected in prices almost immediately, and consistently staying ahead of benchmarks is difficult. Yet understanding the consensus remains essential: before an investor can form a differentiated view, they need to know what the prevailing view actually is—and where it may be changing.
Market prices provide one measure of consensus. But prices alone do not offer an explicit narrative. They tell us what the market is doing, not necessarily why influential investors expect it to move, which assumptions underpin their forecasts, or what could cause them to change their minds.
For that, we need to follow what major market participants are saying.
From scattered publications to a structured view
Many leading asset managers publish detailed house views, market outlooks and investment commentaries. Firms such as UBS, Pictet and BlackRock are often highly transparent about their macroeconomic expectations, asset-allocation preferences and key risks. Demonstrating insight is, after all, an important part of their value proposition.
The problem is not a lack of information. It is that the information is spread across PDFs, webpages, newsletters and periodic updates. Formats differ between firms, terminology is inconsistent, and conclusions evolve over time. Reading every publication is possible; comparing them systematically and maintaining a reliable history is much harder.
We therefore built a workflow on the CountryRisk.io Insights platform to:
track the published house views of selected investment managers;
extract the central narrative, assumptions and investment conclusions from each view;
compare areas of agreement and disagreement across managers;
monitor how views and conviction levels evolve over time; and
update the analysis whenever new material becomes available.
The result is a living map of institutional investment thinking rather than a collection of static documents. At the time of writing, the tracker contains reusable skills for UBS, Pictet and BlackRock, together with a cross-manager comparison framework. Each skill is tailored to the source material and vocabulary of the respective firm; the comparison layer translates those differences without erasing them.
Step 1: Create a dedicated skill for each asset manager
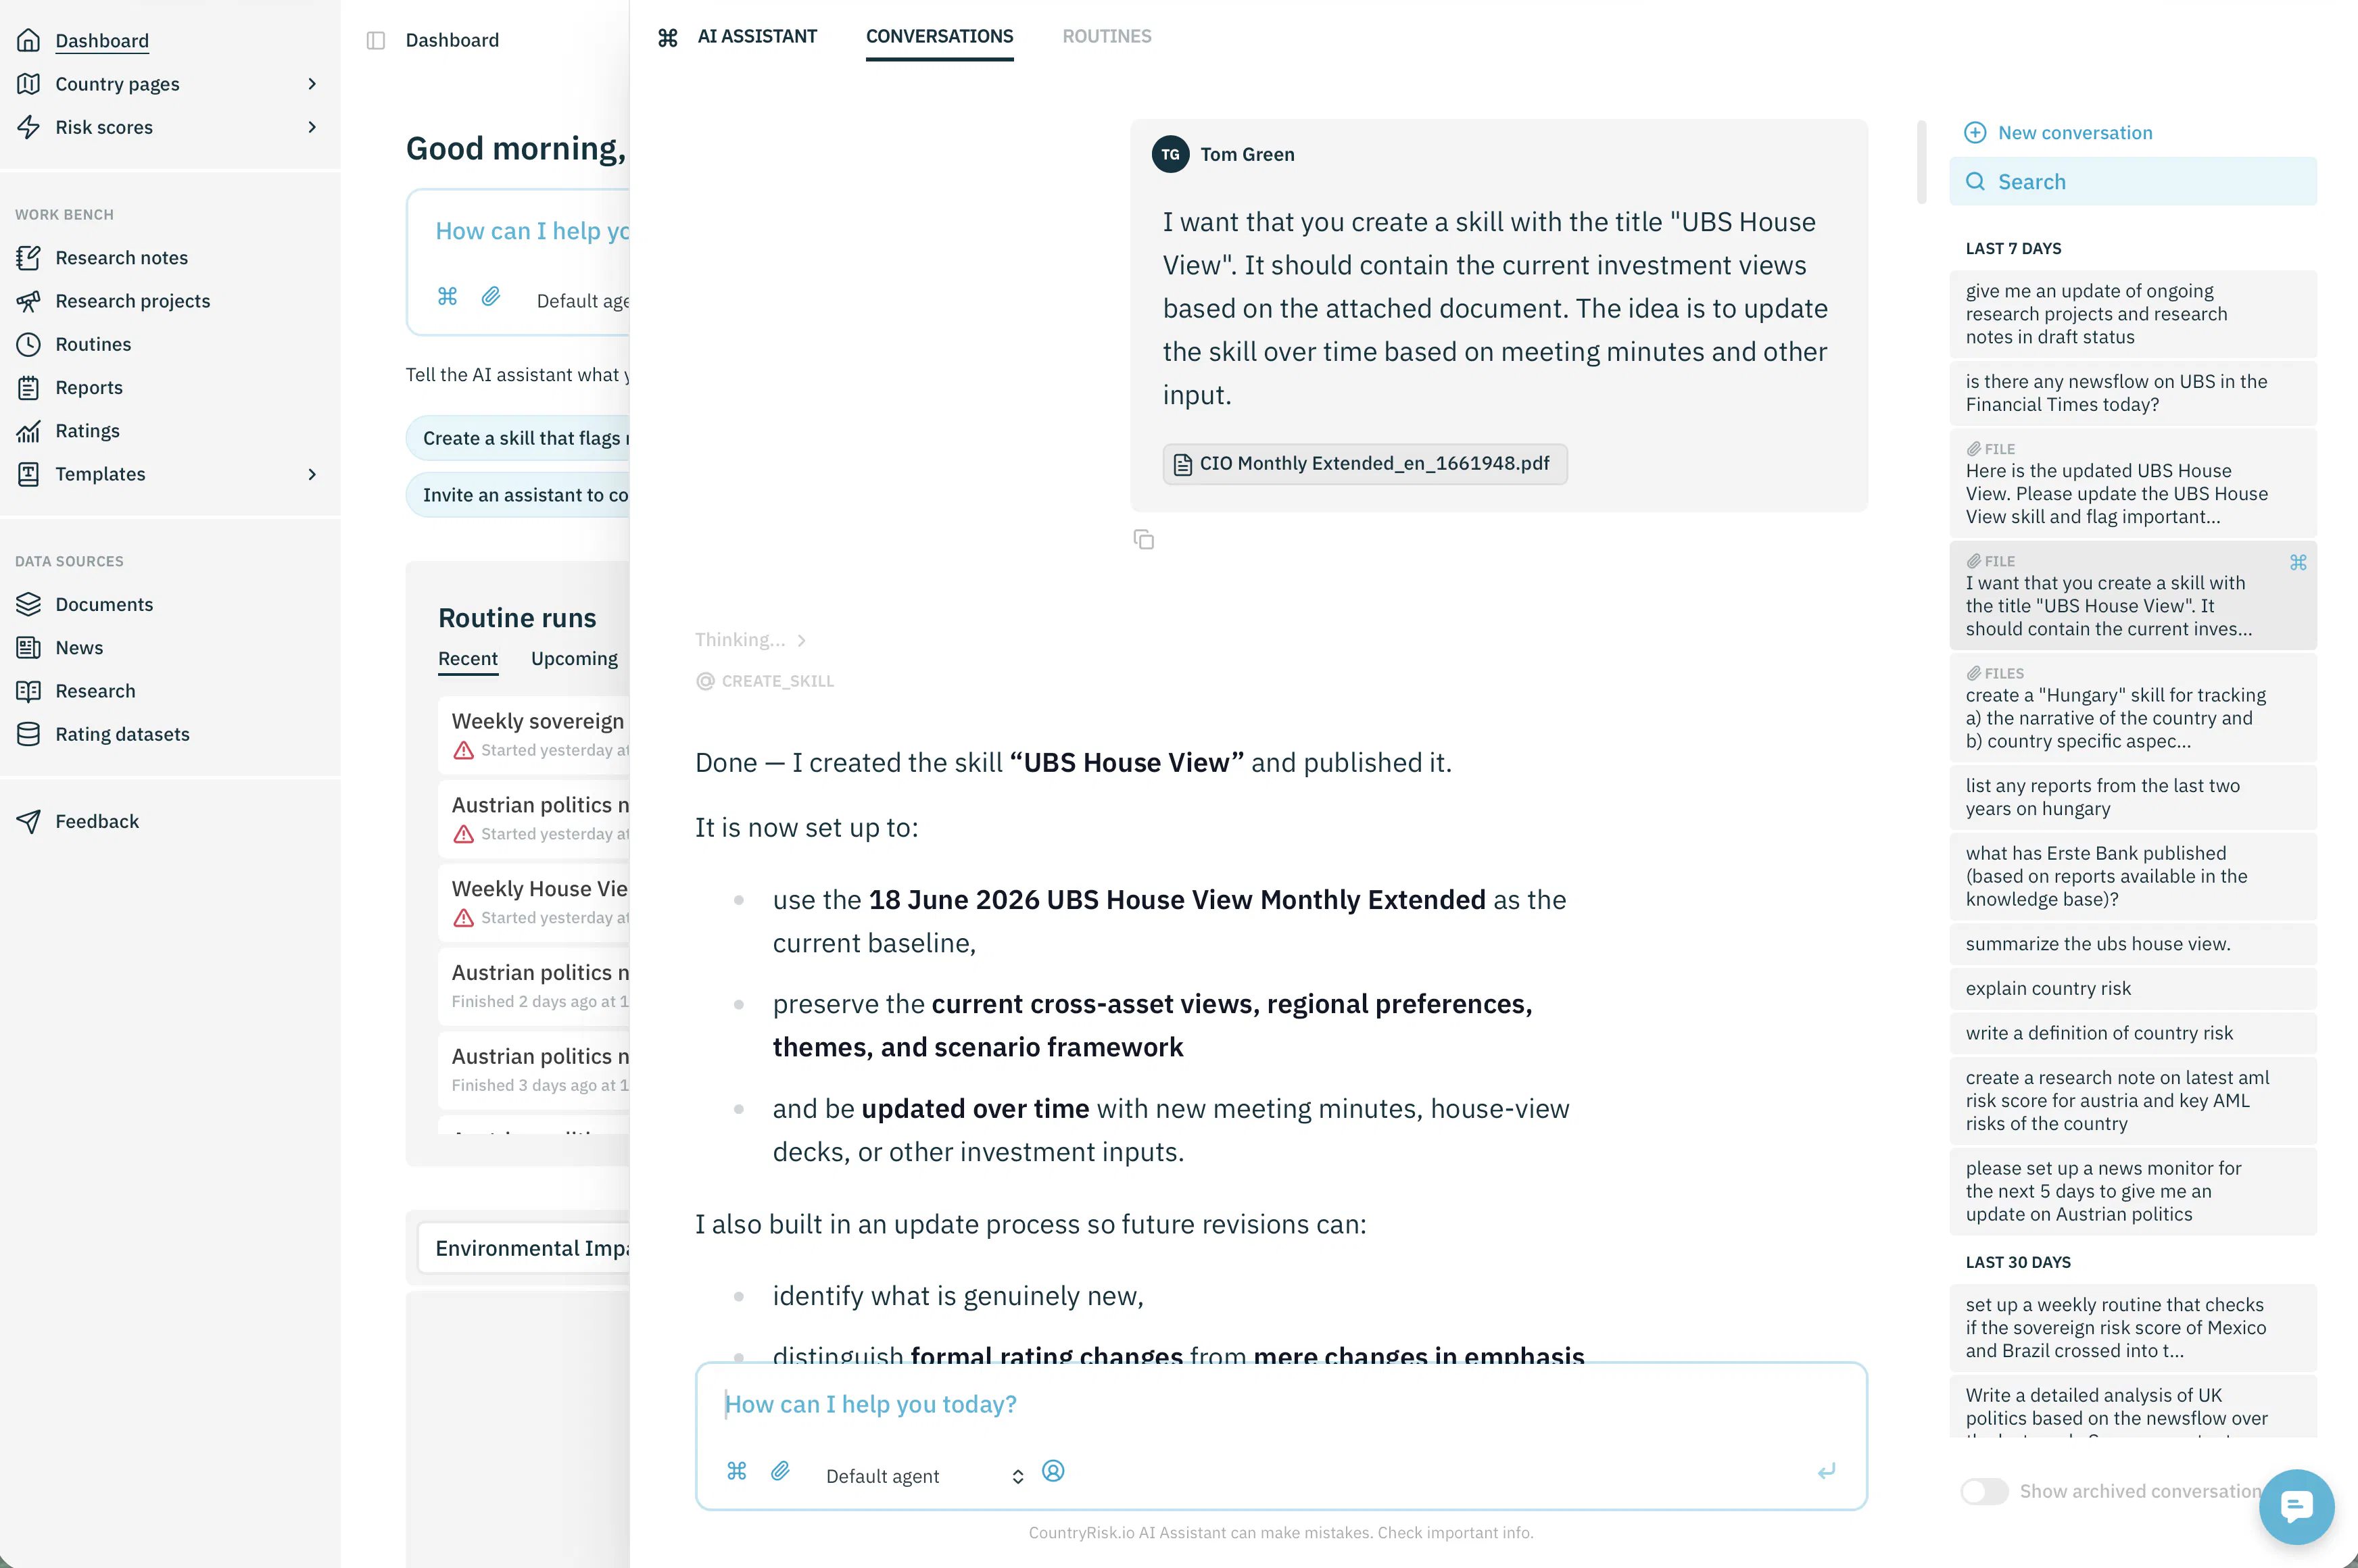
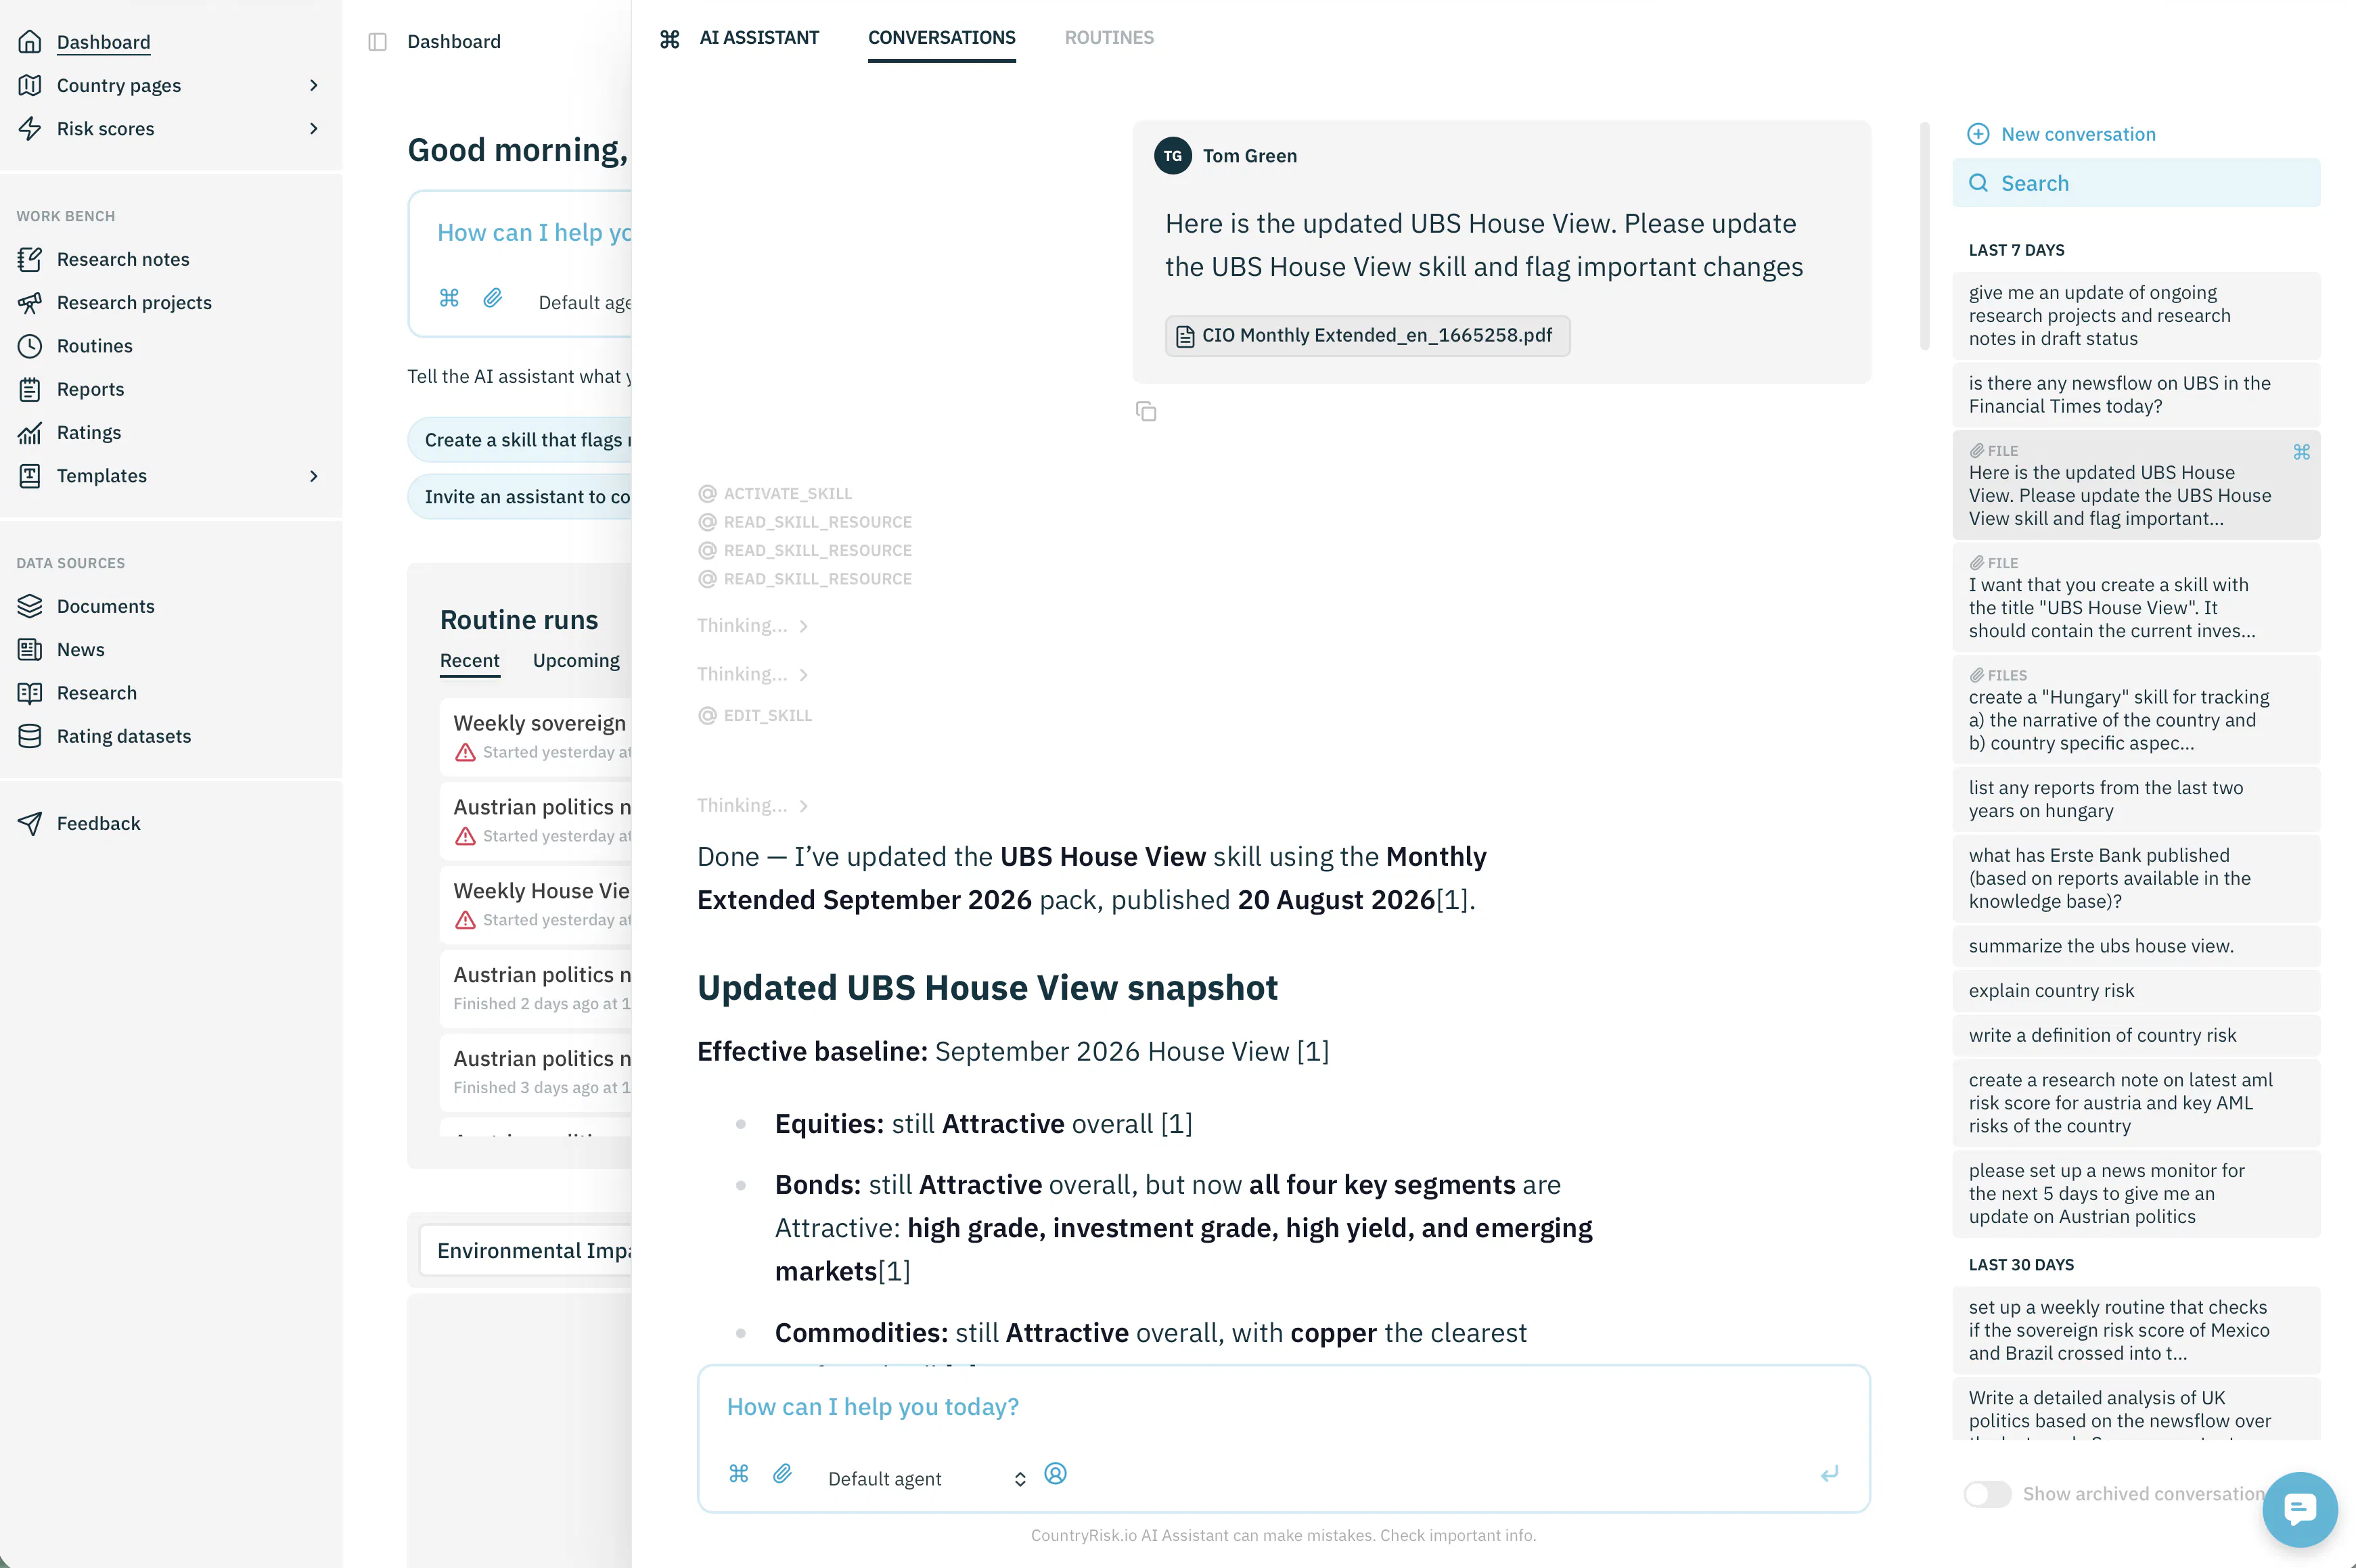
The workflow begins with a representative house-view document—for example, a UBS House View PDF. We upload the document and instruct the CountryRisk.io AI assistant to create a dedicated skill for analysing that manager's publications.
The same process is repeated for each asset manager. The skill defines a consistent analytical structure while retaining the features that make each manager's framework distinctive. In the current implementation, the UBS skill works with CIO House View publications and meeting minutes, the Pictet skill is built around its monthly Barometer, and the BlackRock skill processes Global Outlooks, tactical positioning tables and Investment Institute forum material.
Each skill captures, for example:
the core macroeconomic scenario;
expectations for growth, inflation and monetary policy;
asset-class and regional preferences;
major risks and alternative scenarios;
conviction levels, market targets and investment horizons; and
the data or events that could invalidate the thesis.
The output is not just a summary. It follows a stable template: snapshot date and source hierarchy, executive view, current ratings matrix, macro regime, regional and sector preferences, changes since the last baseline, and watchpoints.
These individual skills make future publications easier to process consistently. They can also contain working-memory resources such as a validated current baseline, a cumulative change log and a template for recording future changes. This separation matters: the skill holds the analytical method, while its resources hold the evolving view.
Step 2: Compare narratives, not just recommendations
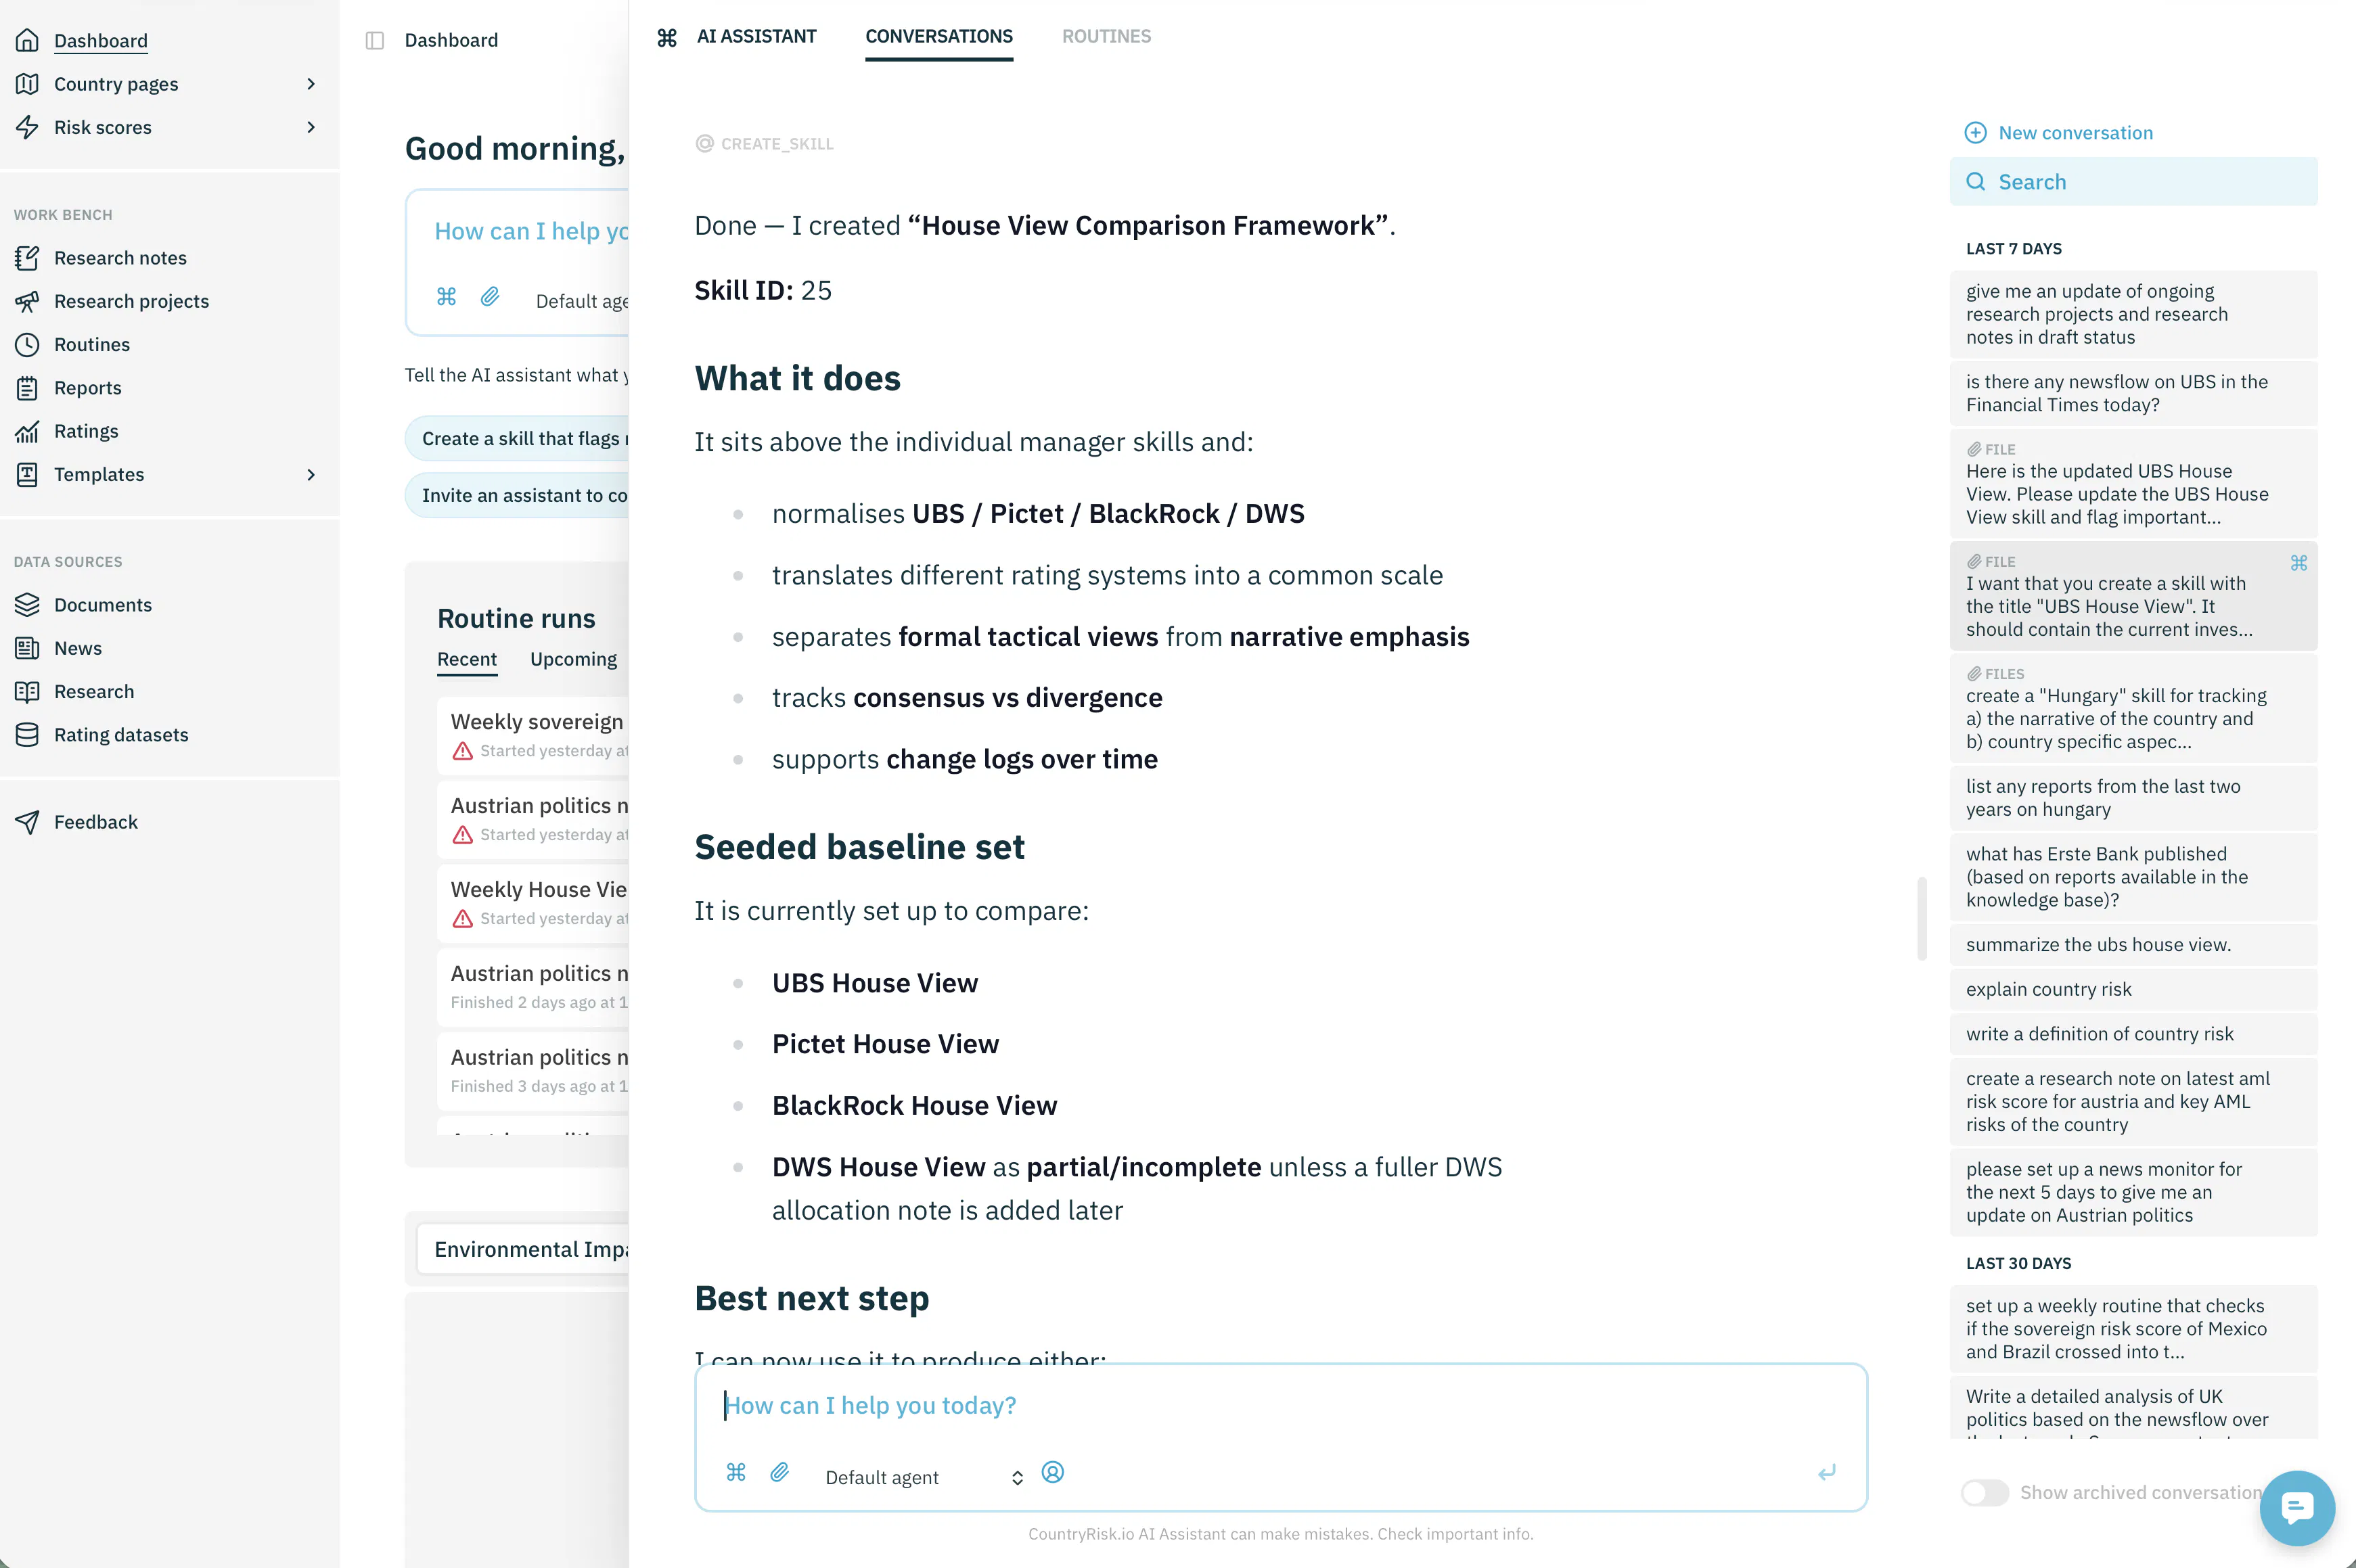
We then create a separate comparison skill that brings the individual house views together.
The objective is not merely to count overweight and underweight recommendations. Two managers may reach the same portfolio conclusion for very different reasons, just as similar macroeconomic assumptions may lead to different investment decisions.
The comparison skill maps every manager into a common schema covering the macro regime, cross-asset positioning, regional equities, sectors and themes, duration and credit, currencies, real assets, alternatives and key watchpoints. It also records the source title, publication date, source type, completeness and confidence in the comparison. A full outlook should not be treated as equivalent to a narrow thematic note.
Different rating languages are normalised into a shared directional scale. UBS's Attractive, Pictet's Overweight and BlackRock's Overweight, for example, can all be mapped to Positive. Neutral and negative ratings are treated in the same way. Where a publication expresses only a qualitative preference, the tracker labels it as such rather than presenting it as a formal tactical position. If a topic is not covered, the result says No formal view stated instead of filling the gap with an inference.
A structured comparison helps answer more revealing questions:
Where is there genuine consensus?
Which manager holds a differentiated view?
What are the main lines of argument behind each position?
Are differences driven by assumptions, time horizons or risk tolerance?
Are views converging or becoming more dispersed?
Is uncertainty rising, and are conviction levels falling?
Which manager changed its position first?
Tracking these questions over time turns the exercise into a useful indicator of narrative momentum. It can reveal not only what the consensus is today, but also how it is forming and where its weak points may lie.
What the comparison reveals in practice
The current skills illustrate why this distinction between ratings and narratives matters.
UBS's validated September 2026 baseline is broadly constructive: equities, bonds and broad commodities are rated Attractive. Within commodities, copper is Attractive, while oil, gold and silver remain Neutral in the detailed grid. UBS prefers quality bonds and short- to medium-term maturities, retains selected pro-growth currency preferences and uses four explicit macro scenarios—from a 60% “Resilient growth” base case to risks around Fed policy and an AI bear market.
Pictet's August 2026 Barometer also favours equities, but is Neutral on bonds and Underweight cash. Its highest-conviction regional equity view is emerging markets excluding China, while gold was upgraded to Overweight. Its narrative emphasises resilient growth, AI-related capital expenditure, stronger earnings and improving market breadth.
BlackRock's June 2026 Midyear Global Outlook frames the environment as “scarcity versus abundance.” It is Overweight US equities, EM local-currency debt and selected short- and medium-term euro-area government bonds, but Underweight long US Treasuries. Its AI thesis focuses not only on software or mega-cap technology but on bottlenecks such as power, chips, data centres, grids and infrastructure.
The tracker can therefore identify a broad pro-equity and AI-linked consensus while preserving meaningful divergences: UBS is positive on bonds overall, Pictet is neutral, and BlackRock explicitly distinguishes attractive shorter-maturity income from unattractive long-duration exposure. Pictet favours gold, UBS is only strategically constructive while retaining a Neutral tactical rating, and BlackRock expresses its real-asset view primarily through infrastructure, energy bottlenecks and resilient supply. A simple sentiment summary would miss most of this nuance.
Step 3: Turn the analysis into a persistent research product
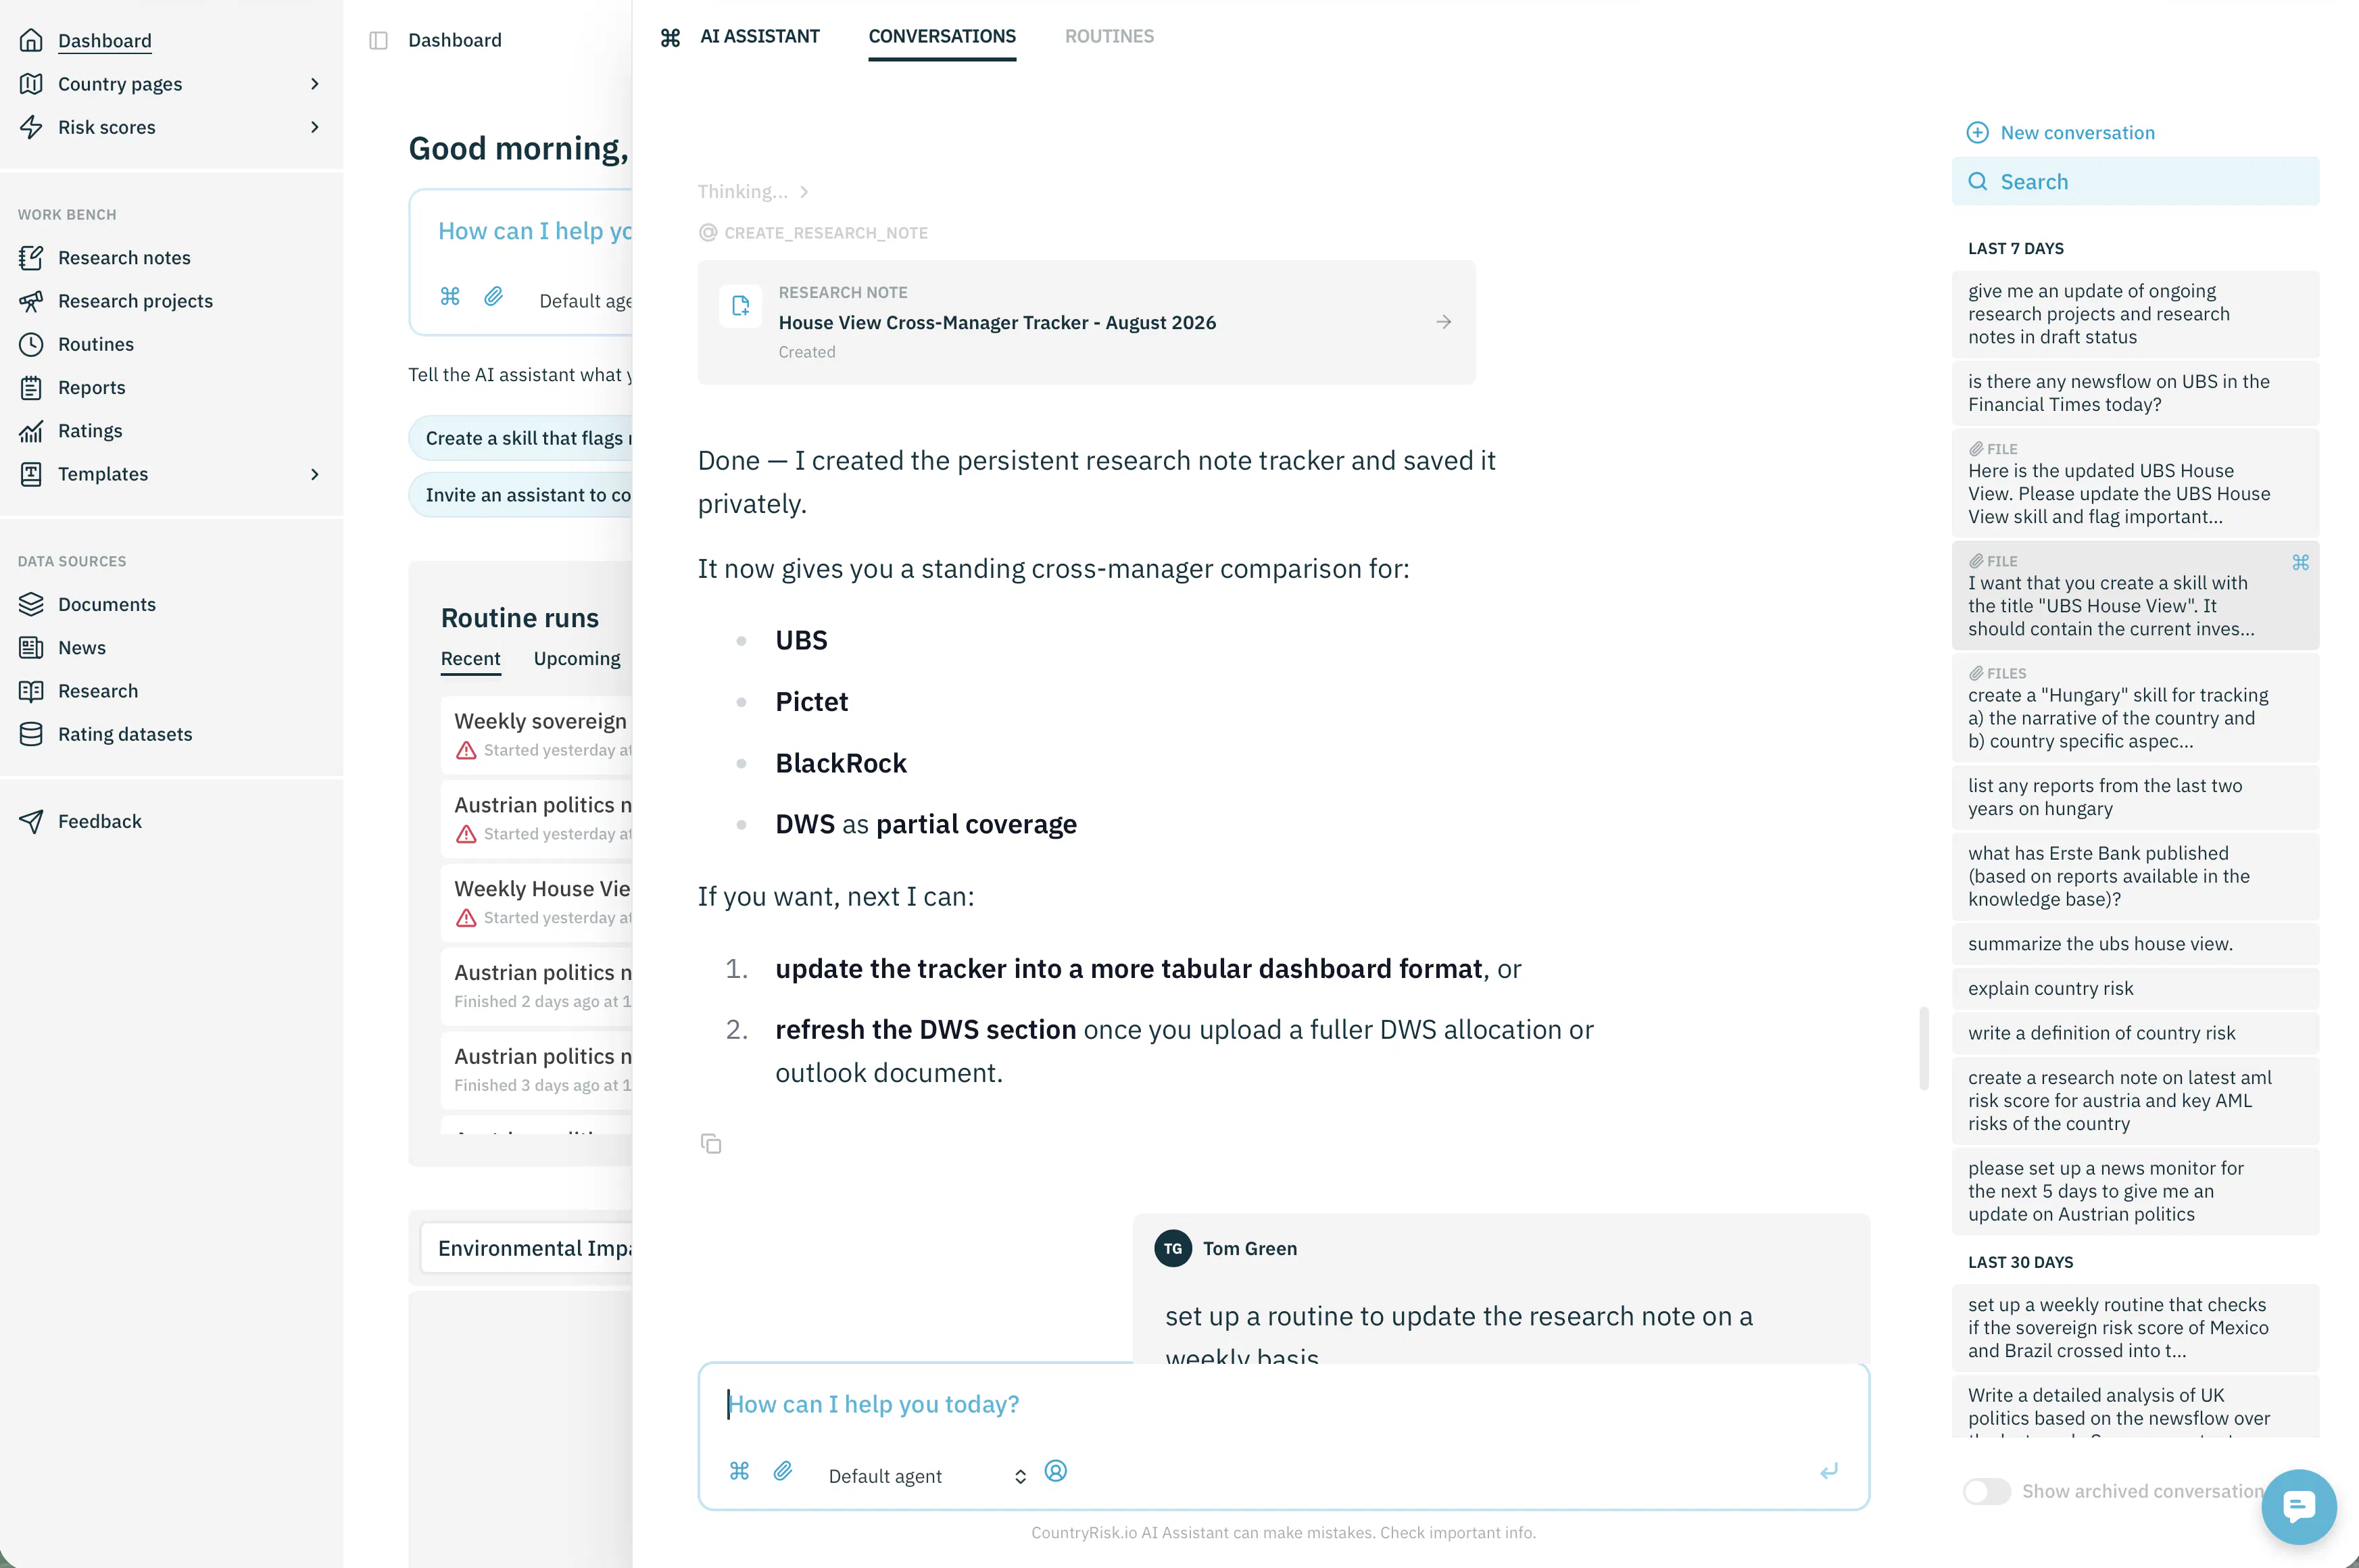
Once the analytical framework is in place, we instruct the AI assistant to create a research note.
A research note is designed for work that needs to persist beyond an individual chat. It combines a full-text editor with AI assistance and offers team-sharing and privacy controls. The finished output can be exported as a Markdown, PDF or Word file.
The standing note can contain a normalised comparison matrix, a consensus map, manager-by-manager nuance, a cross-manager change log and the watchpoints most likely to shift the comparison next. Analysts can review and refine the output, portfolio managers can focus on material changes, and other stakeholders can access a consistent summary without working through every source document themselves.
Step 4: Keep the tracker current
A monitoring system is only valuable if it remains up to date. CountryRisk.io supports both scheduled and event-driven updates.
AI routines can run the workflow regularly, while the Inbox feature supports ad hoc updates. When an asset manager releases a new outlook or strategy note, the document can simply be forwarded to the platform to trigger an update of the relevant house view and the broader comparison.
The update process first establishes the chronology and classifies the new input as a full reset, an incremental update or commentary without a formal rating change. It then separates rating changes, target changes, narrative changes, theme changes, risk-monitoring changes and shifts in emphasis. A full outlook may replace the validated baseline; meeting minutes that address only a few topics update those sections while leaving the rest intact.
The implementation follows several deliberately conservative rules:
the latest dated, comprehensive source governs the baseline;
a formal allocation table takes precedence over constructive or cautious prose;
a full outlook outranks a partial or thematic note for cross-asset positioning;
tactical ratings, structural themes and watchpoints remain separate; and
ambiguous evidence is recorded as directional emphasis, not invented as a rating change.
This reduces the operational burden of maintaining the tracker and shortens the time between publication and analysis. More importantly, the same framework is applied on every update, making changes easier to identify and reducing the risk that an important shift is lost in a new document's wording or layout.
From tracking opinions to anticipating reactions
The workflow can be extended beyond summarising published views. Each investment thesis contains an implicit set of decision variables: economic indicators, market prices, central-bank decisions, political developments and statements from key policymakers.
Extracting and monitoring these variables provides an additional layer of insight. The present comparison framework already highlights watchpoints such as AI monetisation and buildout costs, inflation persistence, bond term premia, Middle East energy chokepoints, China policy and trade restrictions, and the breadth of earnings growth beyond mega-cap technology.
If we know which evidence supports a manager's thesis, we can assess whether incoming data is strengthening or weakening it. This can help anticipate how that manager—and potentially a wider group of investors sharing the same assumptions—may react to a data release or policy announcement.
The tracker can therefore evolve from a record of stated opinions into a forward-looking framework for understanding possible changes in positioning and market narratives.
The same approach can organise your own house view
The workflow is equally useful for organisations that want to structure and distribute their own investment view. An internally maintained skill can make a house view consistently available to relationship managers, risk teams, strategists and investment committees. It can also support tailored communication with external clients.
Instead of repeatedly recreating presentations and summaries, teams can maintain a common analytical framework, update it when assumptions change and generate outputs suited to different audiences. This improves consistency while preserving the judgement and oversight of the investment professionals responsible for the view.
A clearer view of what the market believes
Investment research is abundant; structured comparison is scarce. By combining reusable AI skills, persistent research notes, scheduled routines and simple document ingestion, CountryRisk.io makes it practical to build and maintain a systematic house view tracker.
Such a tracker will not eliminate uncertainty or produce differentiated investment ideas by itself. It does, however, create a stronger foundation for identifying consensus, recognising divergence and understanding the assumptions that could drive the market's next change of mind.
To learn more about building a set of skills that tracks the narratives and decision variables relevant to your organisation, contact us at [email protected].