Build the data you can't buy
Create, upload and share your own country data

Bernhard Obenhuber
Nov 13, 2026
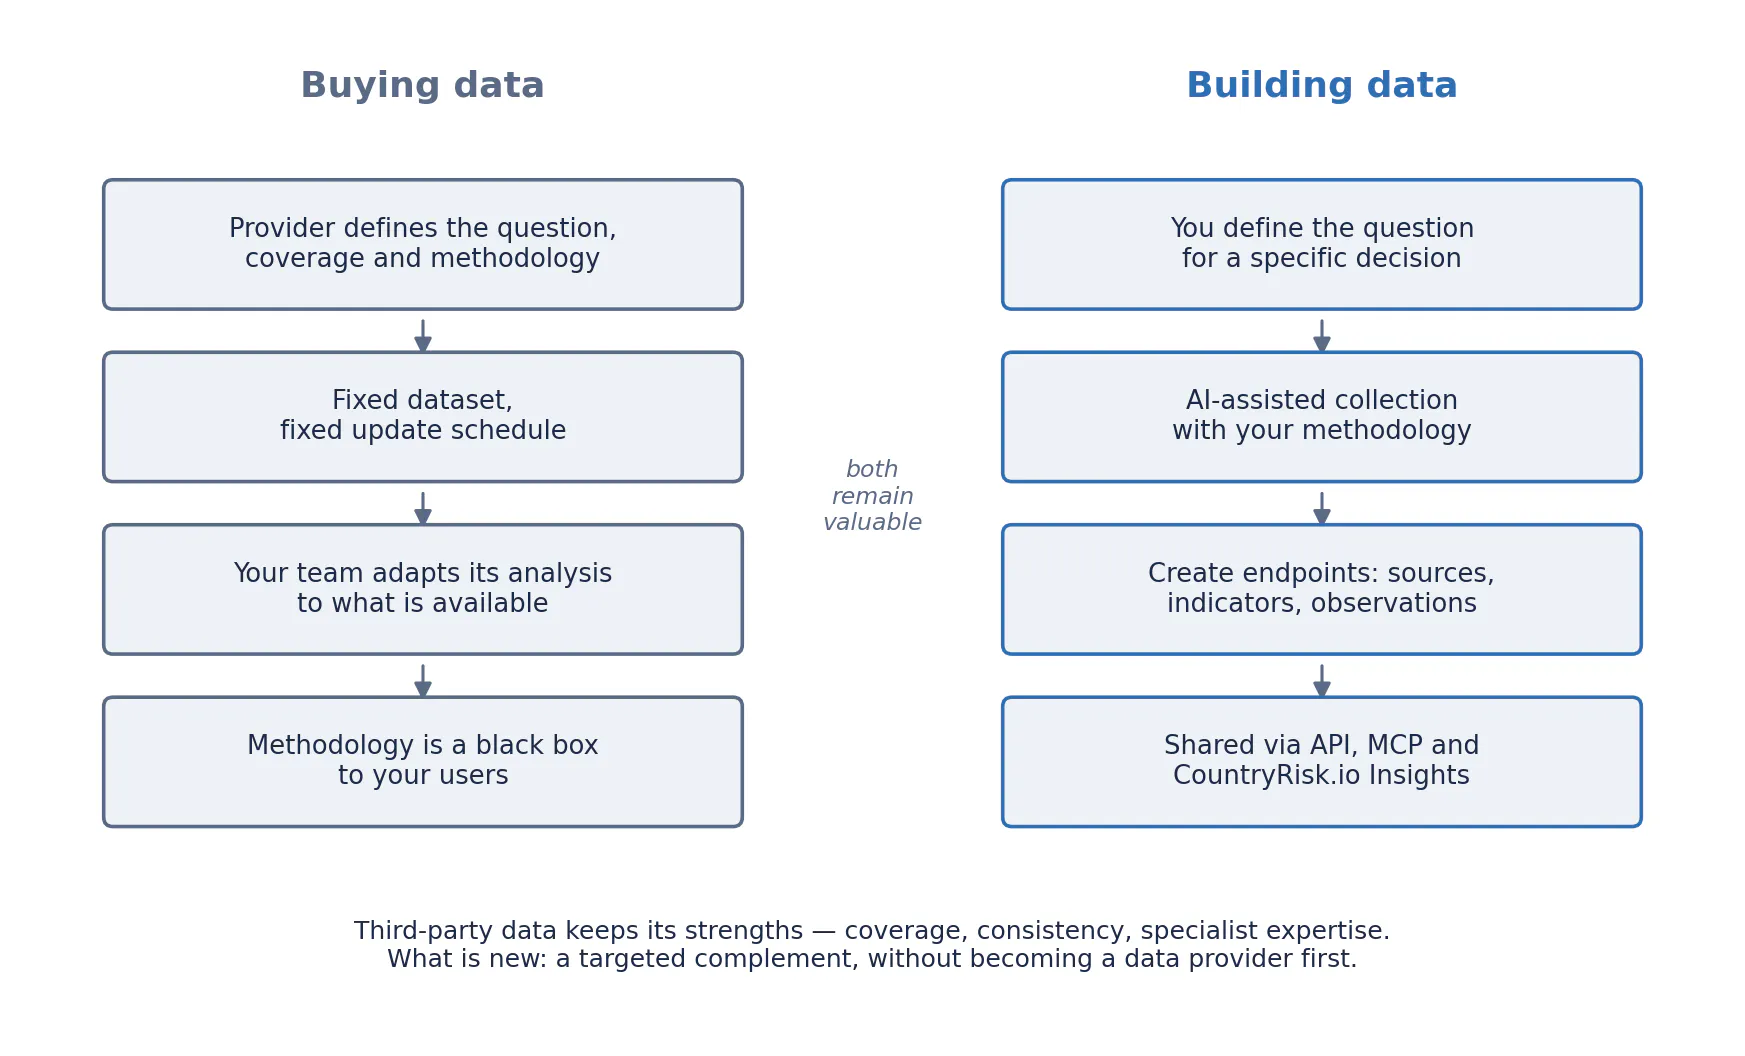
Organisations have traditionally consumed the data that providers chose to produce. If a team needed a news sentiment indicator, a country-risk signal or a measure of market expectations, it would usually purchase an existing dataset—and adapt its analysis to the provider’s coverage, methodology and update schedule.
That model remains valuable. But it is no longer the only option.
AI-assisted research, programmable data sources and accessible modelling tools are making it possible for organisations to construct their own indicators. They can choose the questions, define the coverage, apply their own methodology and build time series tailored to a specific decision.
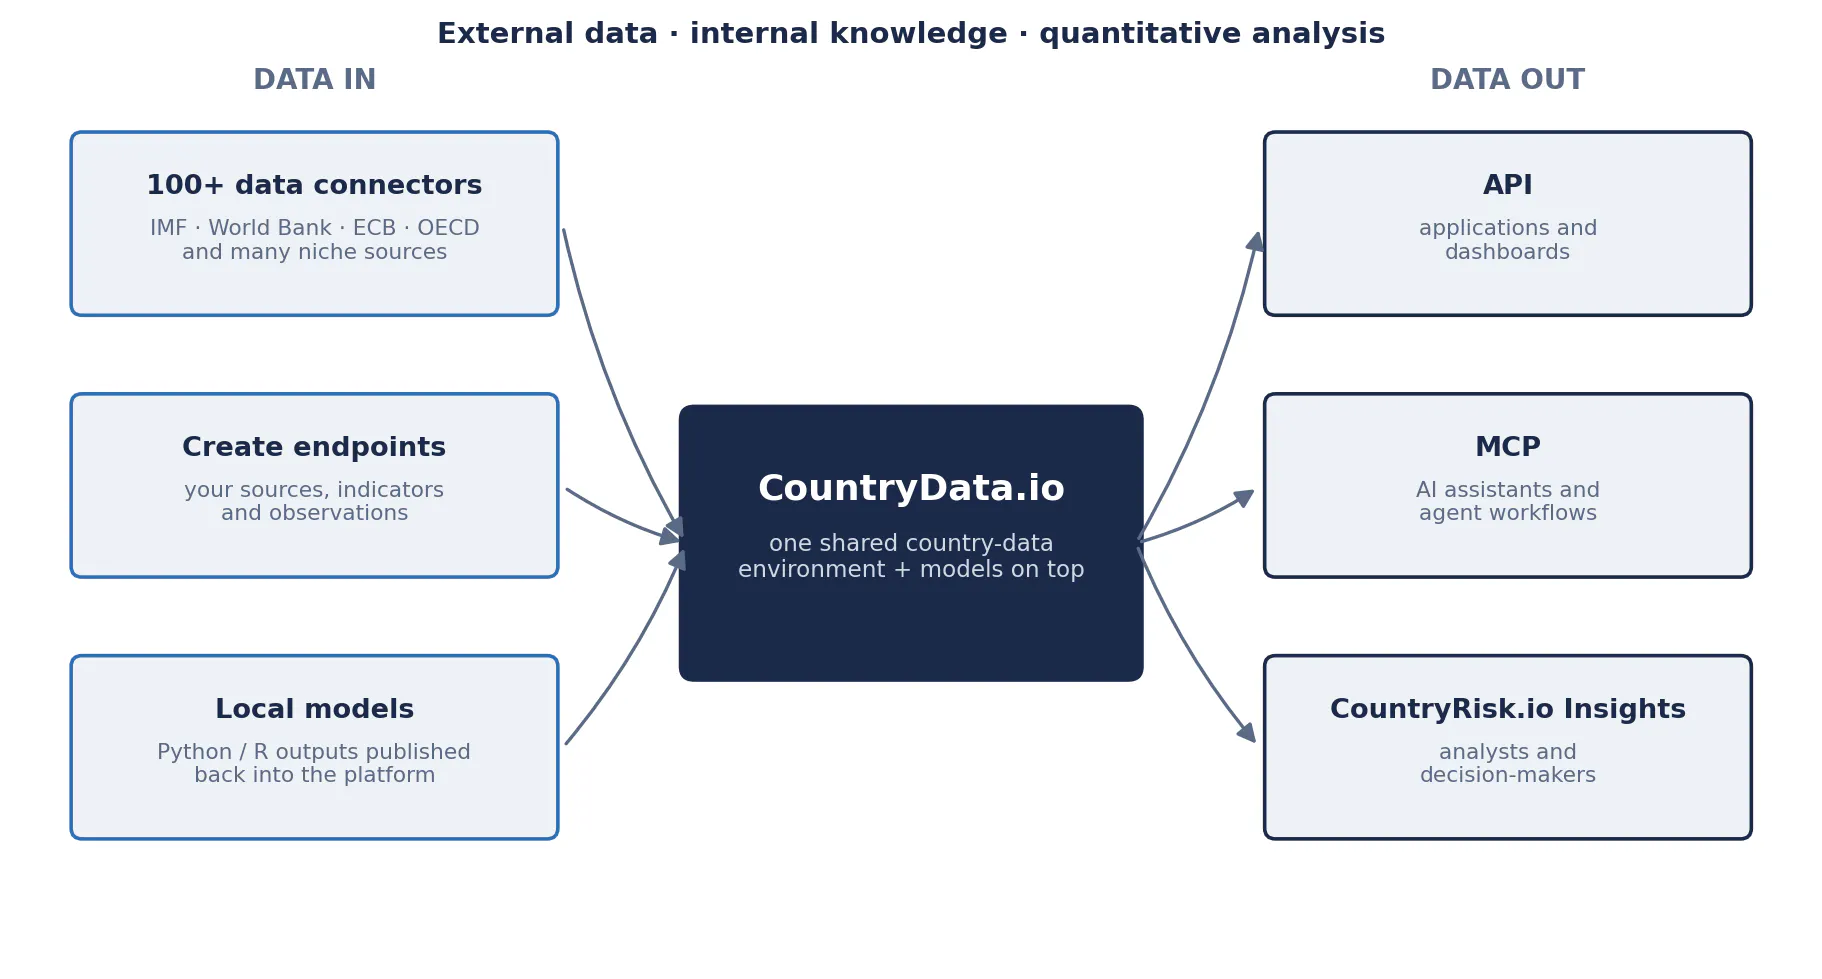
CountryData.io’s new create API endpoints help turn these custom analyses into data that teams and applications can use. Organisations can create sources and indicators, upload observations, and make the resulting datasets available through the CountryData.io API and MCP, as well as within the CountryRisk.io Insights platform.
To show what this looks like in practice, we built a complete news-sentiment dataset from scratch—in a single working session, in a conversation with an AI assistant. This post describes what we built, how the workflow actually unfolded, and what the same endpoints make possible for other use cases.
The nature of data is changing
Many datasets have historically arrived as finished products: a survey index, a sentiment score, a forecast or a risk rating. The provider selected the inputs, defined the categories and decided how to aggregate the results.
Increasingly, data can also be an output of an organisation’s own analytical process.
A supply-chain team might need to monitor political violence in countries where critical suppliers operate. An investment team might want to distinguish inflation narratives from growth narratives. A corporate strategy team might care about policy uncertainty in a small group of export markets.
Those are different questions. They need not share the same indicator.
Third-party surveys and news analytics will continue to offer valuable coverage, consistency and specialist expertise. Custom indicators do not automatically reproduce the representativeness of a well-designed survey or the quality of a mature commercial dataset. What has changed is the ability to build a useful, targeted complement without first becoming a large data provider.
The competitive advantage increasingly lies in defining the right measurement.
From a blank source to a live dataset in one session
The pilot began with nothing but the API documentation and ended, a few hours later, with a verified dataset in CountryData.io. The entire workflow ran as a conversation: describe the next step in plain language, let the assistant call the API, review the result.
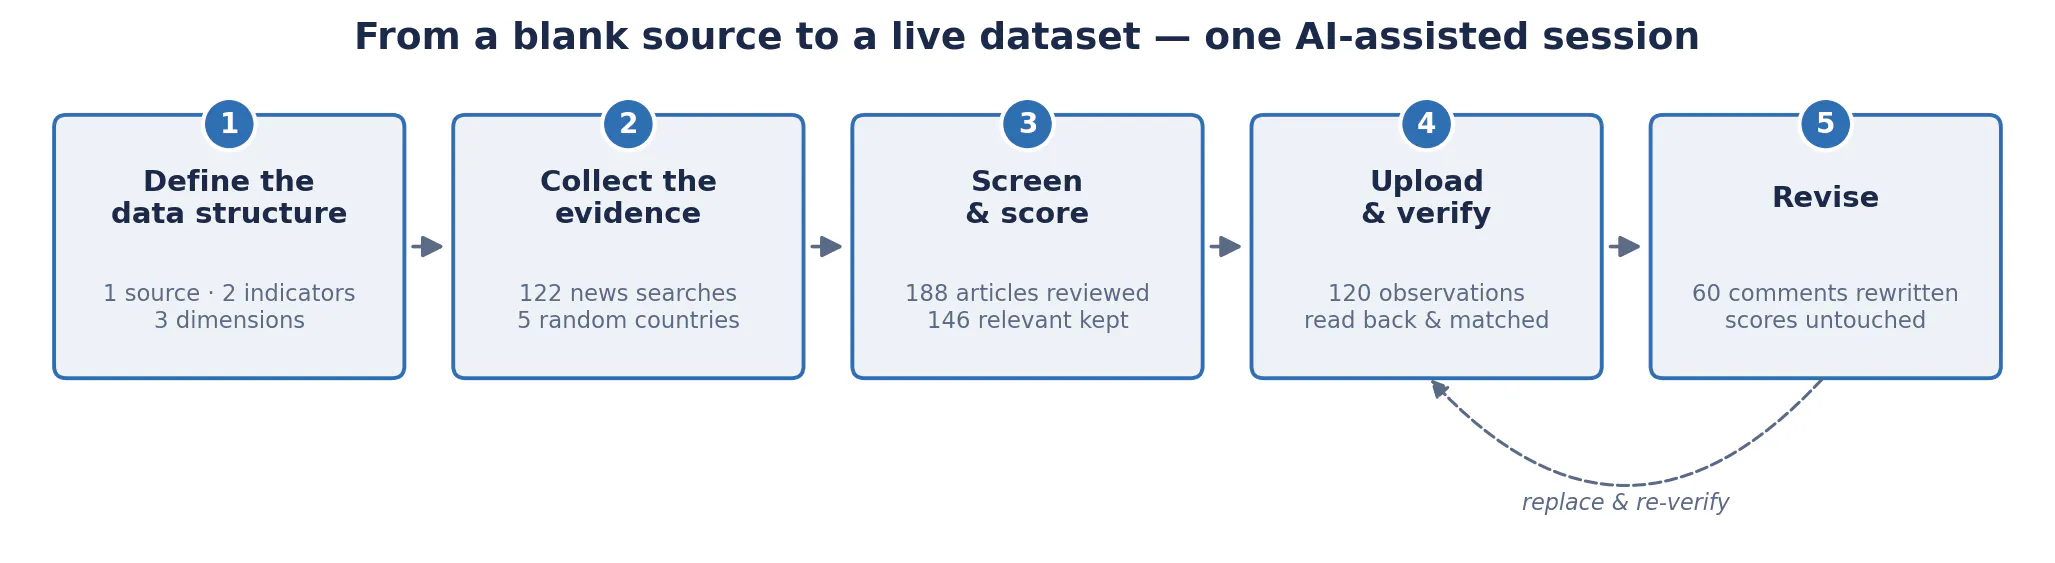
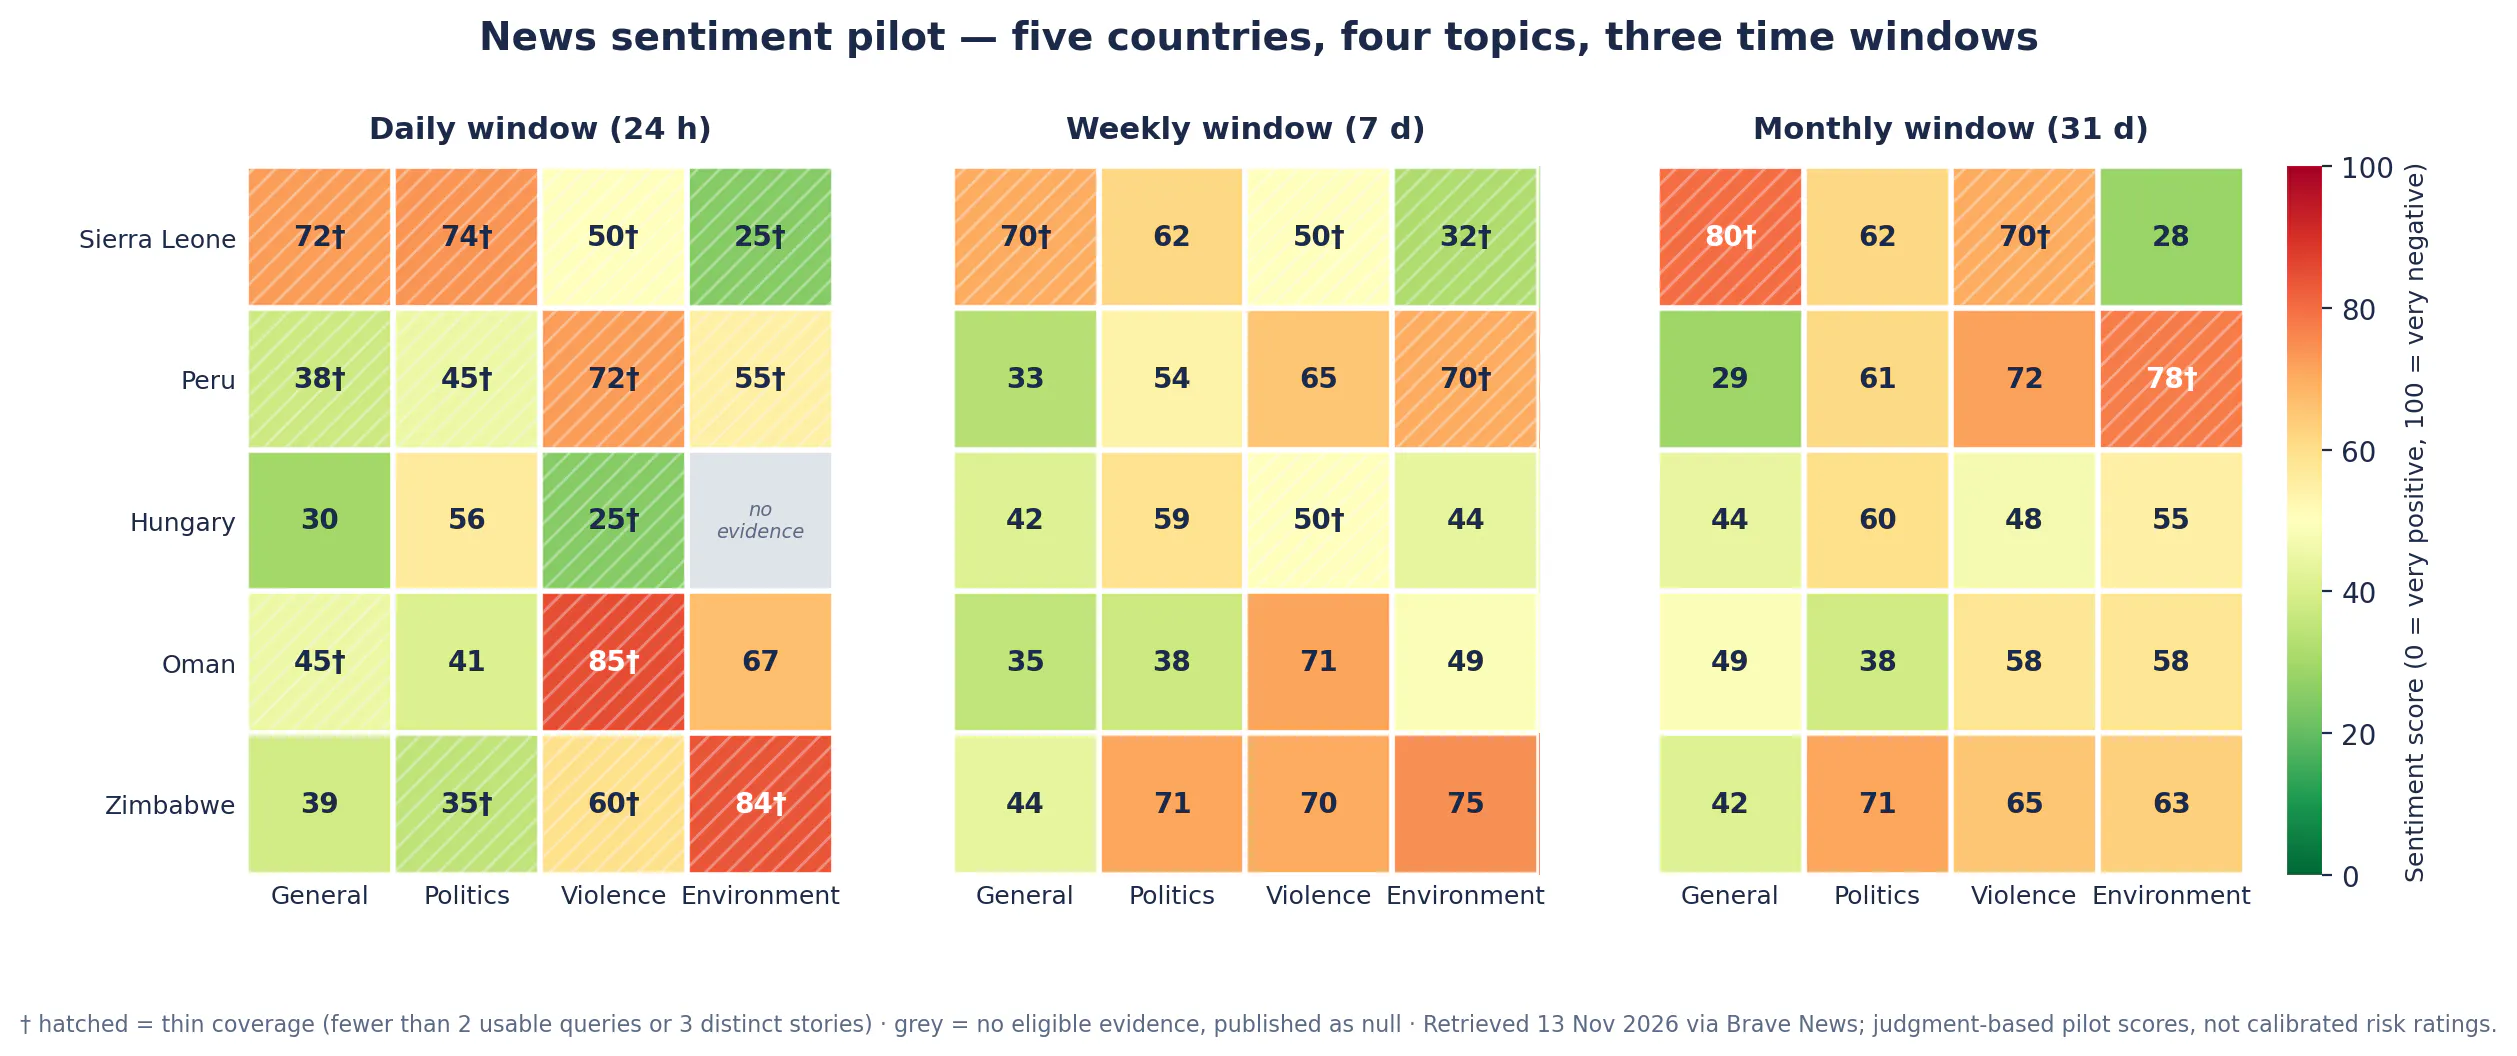
1. Define the data structure. We created a new source, CountryRisk.io Country Sentiment Score, with two indicators: a numeric sentiment score (CR.CTRY.SENT.SCR) and a text commentary (CR.CTRY.SENT.CMT). Three dimensions classify every observation: topic (general, politics, violence, environment), time window (day, week, month) and a boolean thin coverage flag. Score and commentary live side by side as structured data, not as a number in one system and a PDF in another.
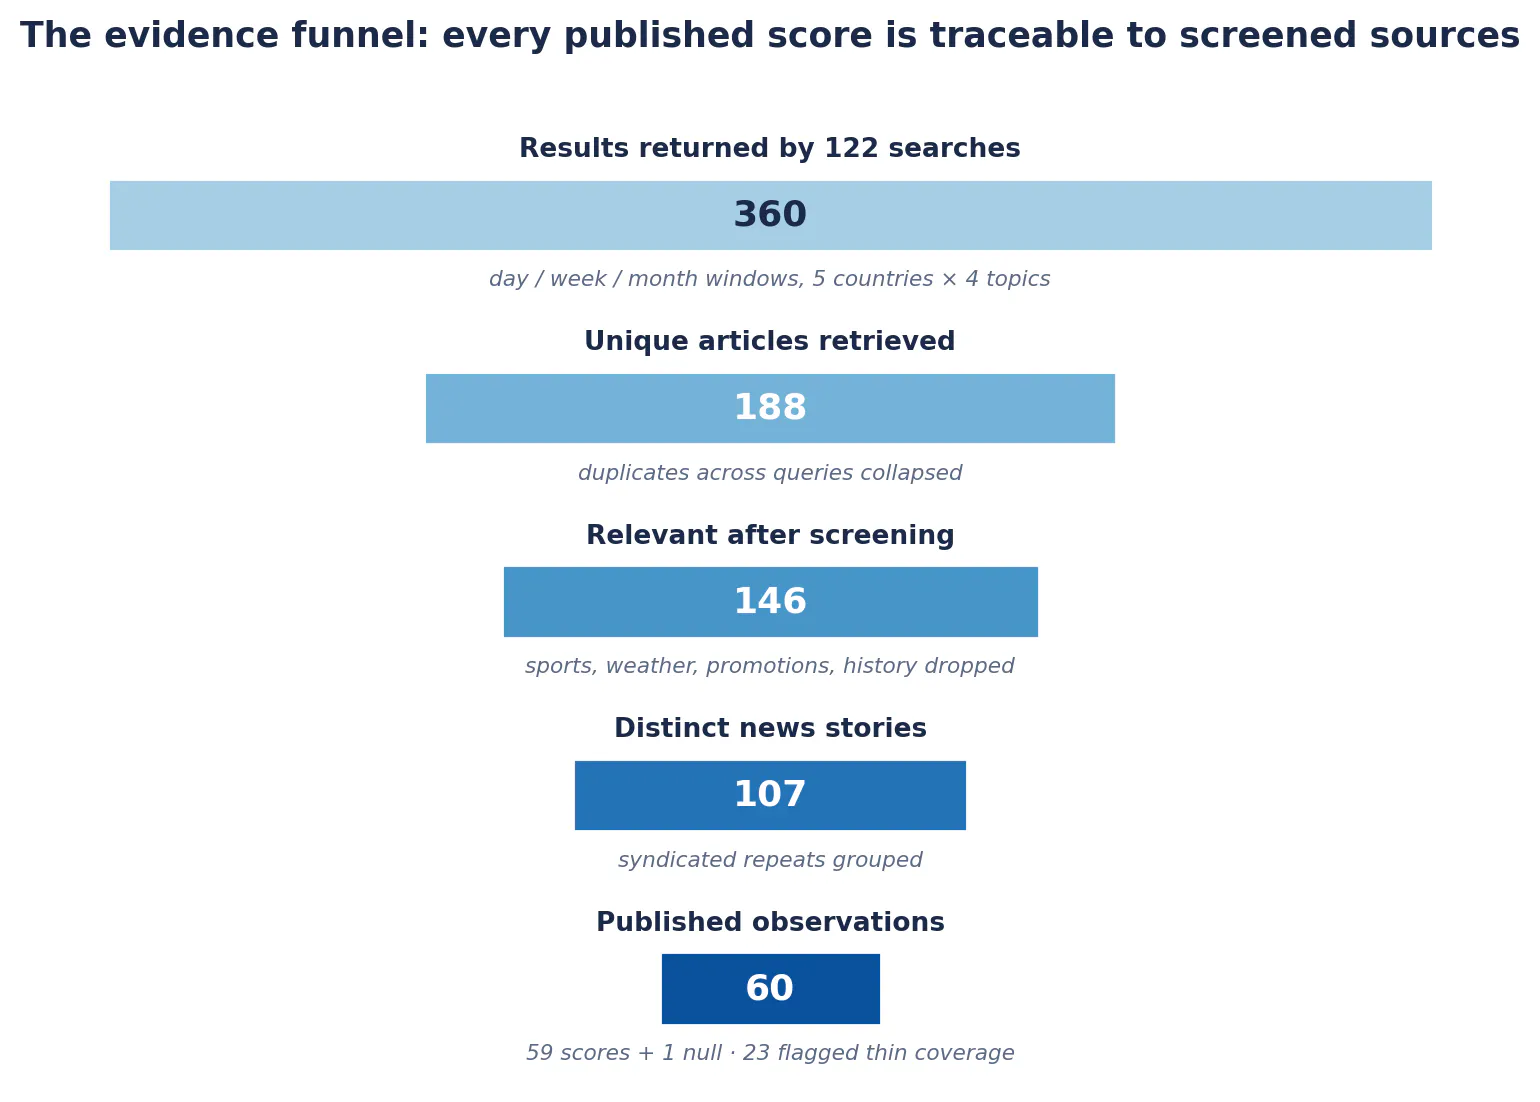
2. Collect the evidence. Five countries were selected at random from the CountryData.io country list—Sierra Leone, Peru, Hungary, Oman and Zimbabwe—using a seeded shuffle, so the selection itself is reproducible and was not influenced by the news. For each country, topic and time window, the assistant ran defined news-API queries with explicit freshness filters: a rolling 24 hours, 7 days and 31 days. In total, 122 searches.
3. Screen and score. Raw search results are noisy. Queries about “violence” return football matches; “environment” returns routine weather forecasts. Each result was screened for relevance, obvious duplicates were grouped, and the remaining articles were scored on a 0–100 scale, where 0 is very positive, 50 is neutral or mixed and 100 is very negative. Query averages were then combined into one score per country, topic and window.
4. Upload and verify. The assistant uploaded 120 observations—60 scores and 60 commentaries, each carrying its topic, time window and coverage flag—through the create endpoints, then read every record back to confirm that the saved values and dimensions matched the upload.
5. Revise. On review, the first round of commentary was too generic. The assistant rewrote all 60 comments against the saved search results—naming the specific developments, figures and sources behind each score—and replaced the records, leaving the scores untouched. Feedback to published revision took a fraction of the usual cycle, because the person defining the methodology and the system producing the data were in the same conversation.
What the output looks like
Each country, topic and window has two complementary outputs: a number and an explanation. A commentary reads like this (Sierra Leone, general news, daily window):
“A Sierra Leone Telegraph opinion article questioned whether constitutional institutions serve citizens in practice… A second opinion article criticized political sycophancy… This was commentary, not a report of a newly verified incident. Sentiment score: 72.5/100. Coverage is thin; these reports should not be taken as a broad national picture.”
The commentary matters. A negative score might reflect a single severe incident, several deteriorating conditions, or critical opinion pieces. Those situations should not be treated as interchangeable. The combination of a number, an explanation and a coverage flag makes the indicator interpretable rather than merely available.
Two design choices deserve emphasis:
- Missing data stayed missing. One combination—Hungary’s daily environment coverage—produced no eligible evidence even after extra queries. Its score was uploaded as null, not imputed to a reassuring neutral. An absence of retrieved news should not become a score by default.
- Uncertainty was recorded as data. Twenty-three of the sixty combinations rested on fewer than two usable queries or three distinct stories. Rather than suppressing or silently averaging them, each carries a thin coverage flag that travels with the observation into every downstream application.
Alongside the uploaded observations, the full evidence trail was preserved: the exact queries, raw API responses, article-level relevance decisions and rationales, the aggregation scripts and a written methodology. Anyone can trace a published score back to the headlines that produced it. Repeated collection with this methodology turns the structure into a time series tailored to an organisation’s monitoring needs.
Bringing locally developed models into a shared data environment
News monitoring is only one application of the create endpoints.
Run models locally, publish the results centrally
An analyst can run an econometric model in a local terminal using Python, R or another preferred environment, then publish its outputs to CountryData.io. “Upload” here does not mean the manual step it is in most organisations today—exporting a file, opening a portal, filling in a template. It is a line of code at the end of the model script, calling the CountryData.io API or MCP, so every model run can publish its own results.
Those outputs could include recession probabilities, inflation forecasts, sovereign-risk estimates or model-implied valuations. Once stored as indicators and observations, they become available to other applications through the API, to AI workflows through MCP, and to colleagues within CountryRisk.io Insights.
This creates a practical connection between local research and shared analytical tools. A useful model no longer needs to remain confined to its author’s notebook or a periodically circulated file.
Make internal macroeconomic forecasts usable
Organisations can also upload their own forecasts for growth, inflation, interest rates, exchange rates or fiscal variables.
Instead of distributing forecasts only through presentations and spreadsheets, teams can make them available as structured data for dashboards, scenario analysis and downstream models.
A carefully designed dataset can distinguish forecast horizons, scenarios and vintages. Preserving those distinctions makes it possible to examine how expectations changed—and to evaluate forecasts against subsequent outcomes.
The same structure also serves clients, not just internal teams. Corporate clients in particular need FX, interest-rate and macro forecasts to flow seamlessly into their own systems—treasury platforms, planning tools, hedging workflows—rather than arriving as a PDF to be retyped. Publishing forecasts as structured indicators on CountryData.io makes them consumable through the API wherever the decision is actually made, such as sizing an FX hedge.
Track consensus, positioning and market narratives
The same approach supports monitoring of macroeconomic consensus forecasts, reported asset-allocation positioning and the narratives shaping investment decisions.
A team could track revisions to growth expectations, changes in published equity allocations, or the prevalence of themes such as recession, disinflation and fiscal stress.
These measures answer different questions. Commentary expressing enthusiasm for an asset class is not evidence of an actual portfolio allocation. Keeping measured positioning, stated intentions and inferred narratives separate makes the resulting indicators more useful.
A concrete example: an asset-allocation team can set up a recurring monitoring routine that tracks what other investors are publishing as capital market assumptions—expected returns, risk premia, strategic weights. The prevailing market narrative becomes a score, collected on a consistent methodology and stored as a time series. The in-house view can then be compared against it systematically: where the two diverge, the team knows exactly where its positioning rests on a contrarian assumption—and can decide deliberately whether that divergence is conviction or oversight.
Adding timely signals to structural risk models
Custom news indicators can also augment existing quantitative models.
Consider a supply-chain risk score built primarily from structural data: infrastructure quality, institutional strength, trade dependence or economic concentration. These variables help explain persistent vulnerabilities, but they often move slowly.
A war, terrorist attack, port disruption or natural disaster can change operating conditions much faster than those datasets update.
A news-monitoring component can flag such events and bring them to an analyst’s attention. The structural score provides the underlying country context; the news signal identifies developments that may require an immediate review. The pilot’s dimension structure supports exactly this: a violence-topic score that jumps on the daily window, with its commentary explaining why, is a natural alert trigger.
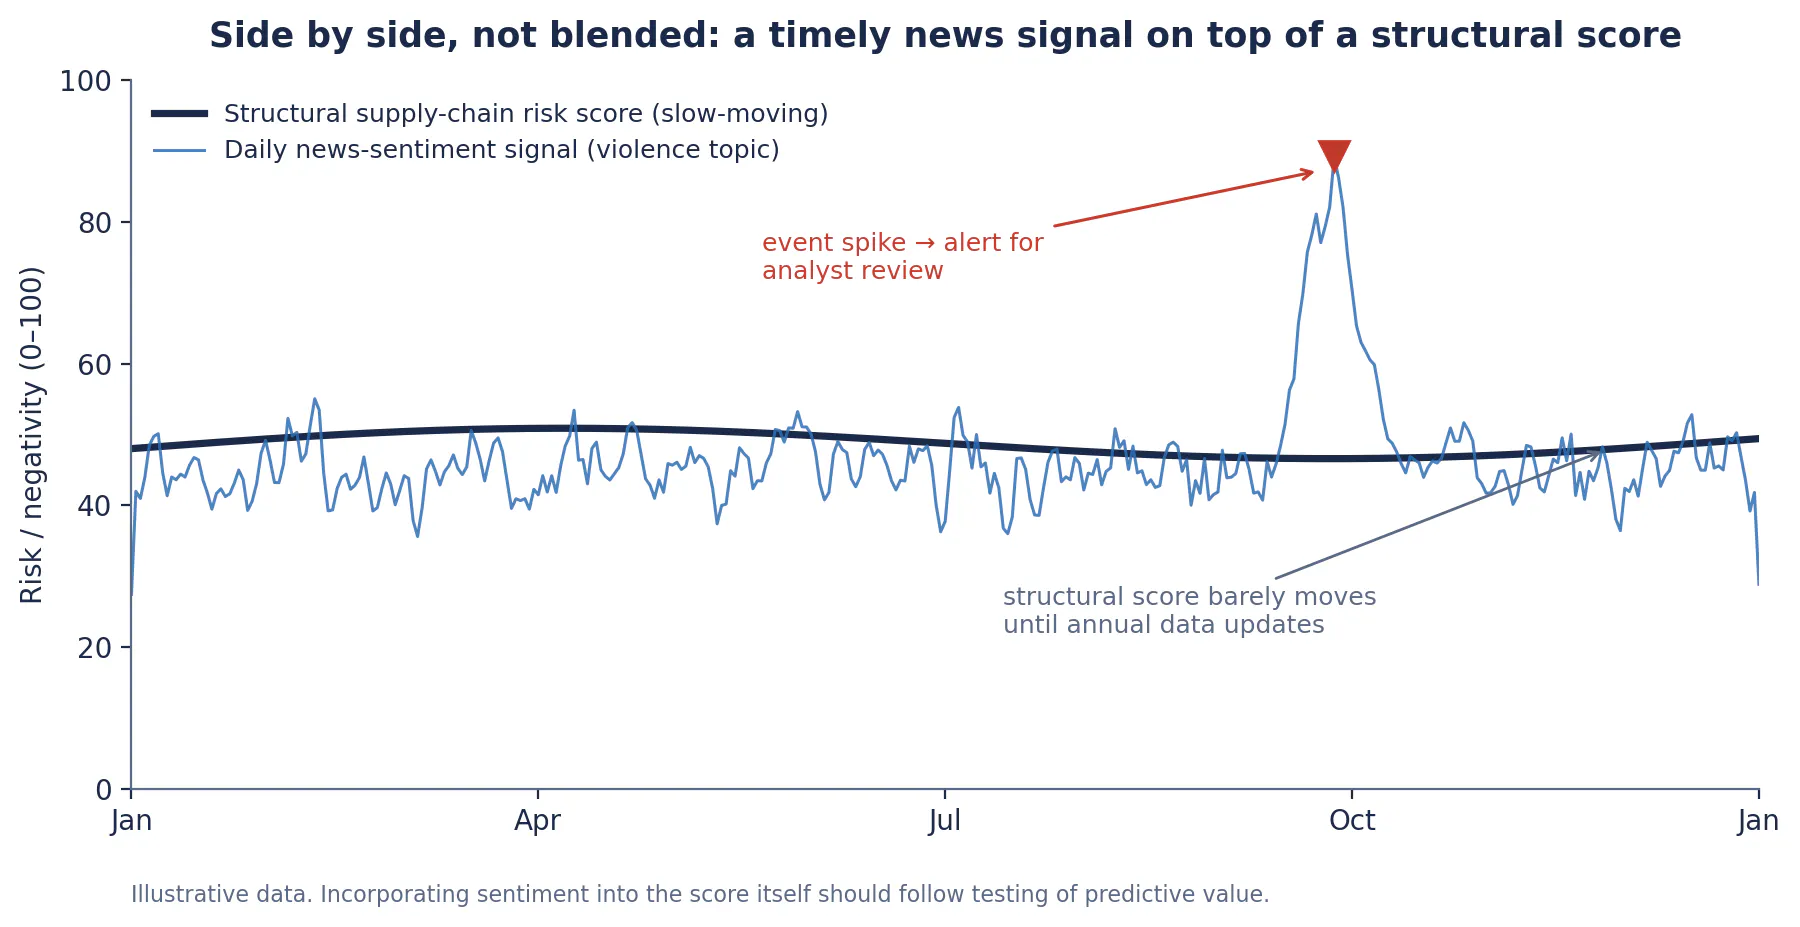
Initially, it may be most useful to display the two side by side or use the news signal to trigger alerts. Incorporating sentiment directly into a quantitative score should follow testing of whether it improves predictive performance and decision-making.
More flexibility brings more responsibility
Building a custom indicator is easier than demonstrating that it is reliable.
Query design, source selection, language coverage, duplicate reporting and scoring choices all influence the result. A change in methodology can look like a change in the world unless it is documented. The pilot made these trade-offs explicit rather than hiding them: the scores are judgment-based readings of retrieved news, not calibrated risk ratings, and the documentation says so.
Useful custom datasets therefore need clear definitions, consistent collection, traceable sources and explicit treatment of uncertainty—reproducible selection, preserved evidence, flagged thin coverage, nulls instead of imputed values. Numbers become more valuable when users can understand what produced them.
CountryData.io’s create API endpoints provide a way to put these organisation-specific datasets into use. The broader shift is from consuming a fixed catalogue of information to constructing measurements around the decisions that matter.
The question is no longer only “Which dataset can we buy?” It is also “What should we measure—and how can we make that measurement useful across our organisation?”
With this latest feature extension, CountryData.io has become a full-fledged solution for country-level data management. Organisations can consume data from more than 100 data connectors—including the IMF, World Bank and a wide range of niche sources—while creating and maintaining their own data sources for internal use: defining datasets and indicators, adding observations and keeping them up to date. They can also run quantitative models on top of CountryData.io data and publish the results back into the platform. Together, these capabilities connect external data, internal knowledge and quantitative analysis in one shared data environment, accessible through the CountryData.io API and MCP and within CountryRisk.io Insights.