InsightsFrom Data to Insight: Using the FRED MCP in CountryRisk.io’s Research Workbench
From Data to Insight: Using the FRED MCP in CountryRisk.io’s Research Workbench
Connect trusted data, explore economic indicators and create branded charts within CountryRisk.io Insights.
Bernhard Obenhuber Nov 10, 2026
The value of connecting data providers is not simply having more series to search. It is being able to move from a question to a checked dataset, an informative chart and a research output—without repeatedly changing tools.
Macroeconomic and sovereign-risk research rarely fits neatly within one database. Analysts need to bring together economic indicators, financial-market data, country-risk assessments and their organisation’s own research. CountryRisk.io Insights is designed to bring these inputs into a common working environment, combining data retrieval, analysis, charting and writing. Through CountryData.io and Model Context Protocol (MCP) integrations, that environment can accommodate public and proprietary datasets rather than being confined to a single provider.
The distinction matters. A database helps answer, “Do we have this series?” A research workbench helps answer, “Is this the right series, how should we interpret it, and what can we do with it in the context of our objective?”
A recent exercise using the FRED MCP connector illustrates that progression—and why flexibility matters when a standard tool reaches its limits.
A new connection to a familiar data source
The Federal Reserve Bank of St. Louis announced its official FRED MCP connector on 4 October 2026, in a post titled “Connect your AI assistant to FRED”. The connector lets AI assistants search for indicators, inspect metadata and methodology notes, retrieve observations, generate downloadable files and render FRED graphs.
MCP provides a common standard for connecting AI tools to external data sources. In this case, it allows an analyst to work with FRED through a conversation inside a compatible research environment, rather than manually moving between a data website, spreadsheet and charting application.
The useful feature is not merely conversational access. It is that the connection exposes the information needed to work responsibly with economic data: series identifiers, units, frequency, seasonal adjustment, coverage and source notes.
Start with the question—not the ticker
Our exercise began with a straightforward request:
“I am looking for the Baa spread.”
That sounds precise, but it leaves an important question unanswered: the spread over what?
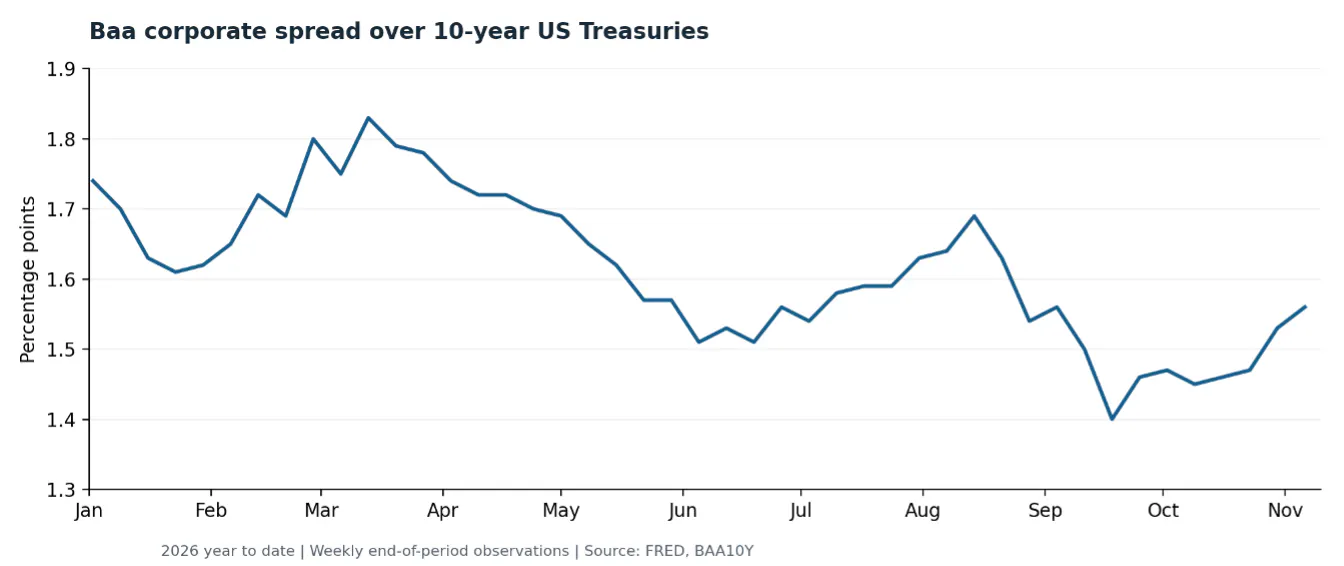
The search identified BAA10Y, Moody’s seasoned Baa corporate bond yield minus the 10-year US Treasury yield. It also distinguished that spread from the Baa corporate yield itself. The user then confirmed that the Treasury comparison was the intended measure.
This is a small example of a valuable discipline. Natural-language search should help identify the right indicator, not conceal ambiguity behind a plausible-looking chart.
Once the series was established, the next request was simple:
“Make a line chart showing it year to date.”
The connector’s graph tool returned a native FRED chart and a link to its interactive version. FRED’s official documentation describes this ability to create multi-series graphs, with transformations applied to individual series.
Baa spread over 10-year US Treasuries. Recreated in Python for this document using weekly end-of-period FRED observations, rather than the daily observations in the original native chart. Data through 6 November 2026.
For a first look at a time series, this is an efficient route: identify, verify and visualise.
From one indicator to a monitoring dashboard
The conversation then moved from credit spreads to growth:
“Which nowcasting indicators for GDP or output are available from FRED?”
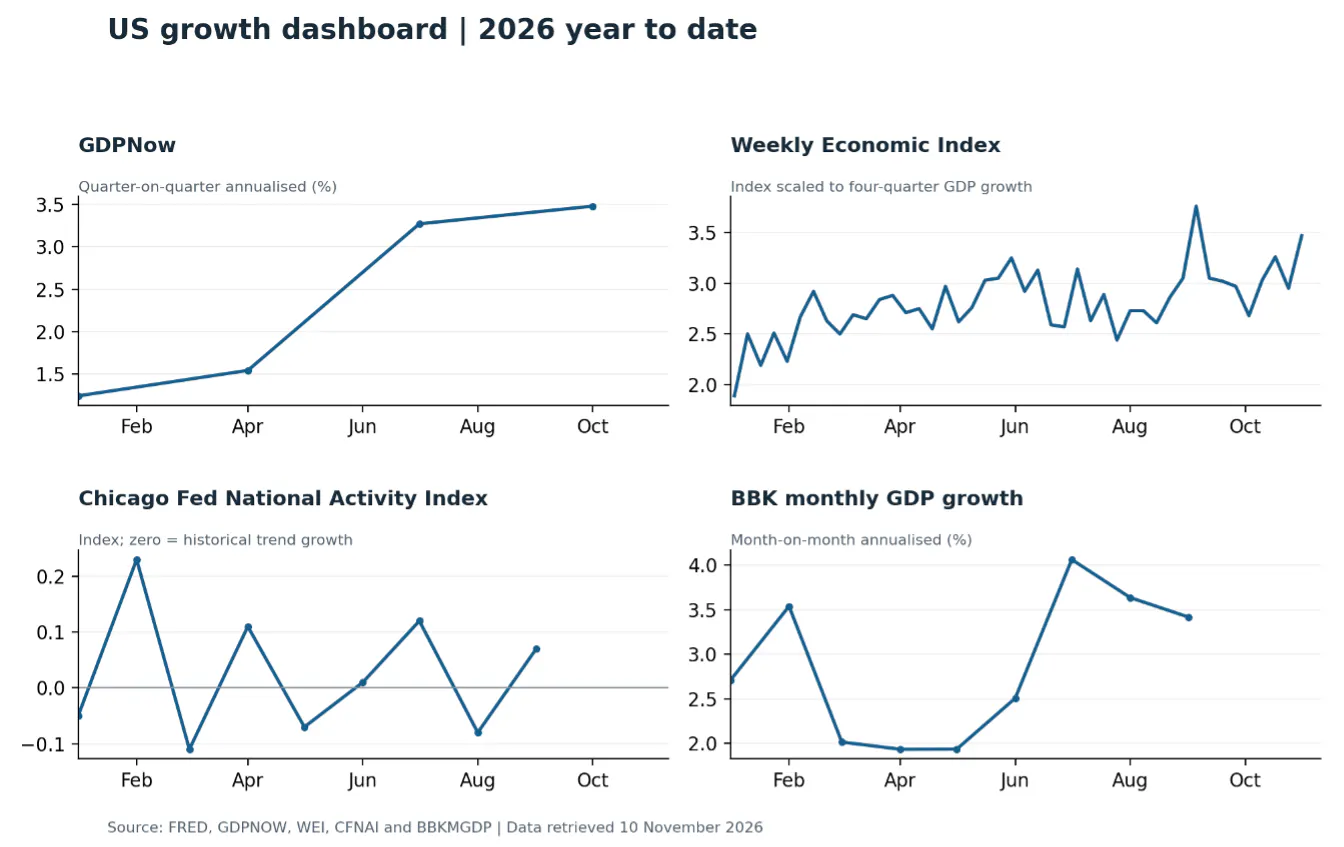
The resulting shortlist covered four different analytical purposes:
Atlanta Fed GDPNow: a current-quarter GDP growth estimate.
Weekly Economic Index (WEI): a high-frequency measure of economic activity.
Chicago Fed National Activity Index: activity relative to historical trend.
Brave–Butters–Kelley monthly GDP growth: a model-based monthly output estimate.
We used these to build a four-panel dashboard. Keeping the indicators in separate panels avoided presenting unlike units and growth horizons as though they were interchangeable.
Four complementary views of US growth, recreated in Python from FRED data retrieved on 10 November 2026. GDPNow shows quarterly target estimates, not successive within-quarter forecast revisions.
That distinction became particularly important when comparing WEI with realised GDP. WEI is scaled to four-quarter GDP growth, so the appropriate comparison was real GDP growth year on year, not the more familiar quarter-on-quarter annualised headline.
The broader lesson is that easy access to data does not remove the need for economic judgement. It makes the checks—definitions, transformations and comparable periods—part of the same workflow.
Native charts are convenient, but an integration can have limits
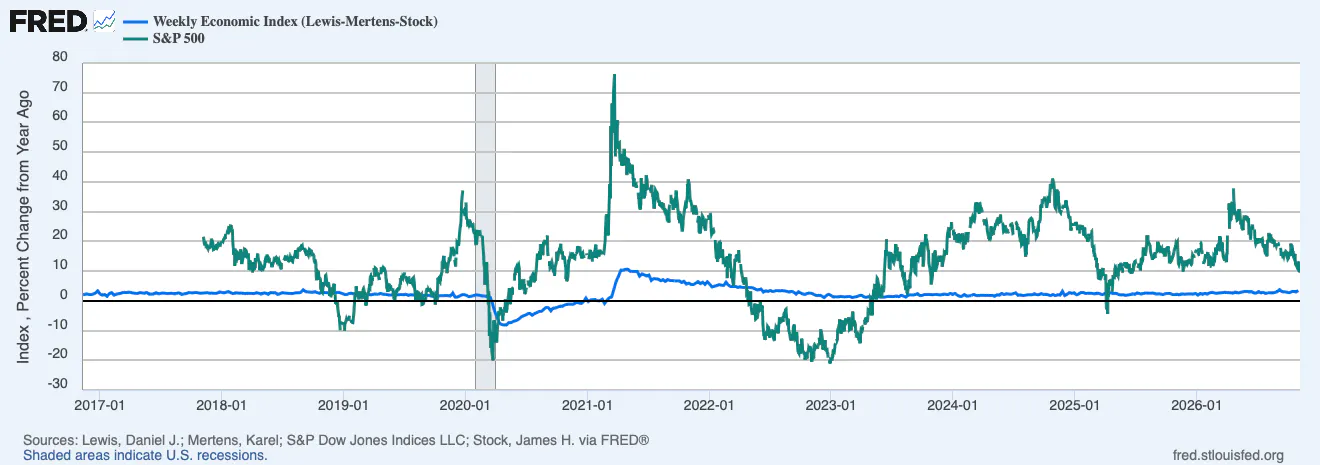
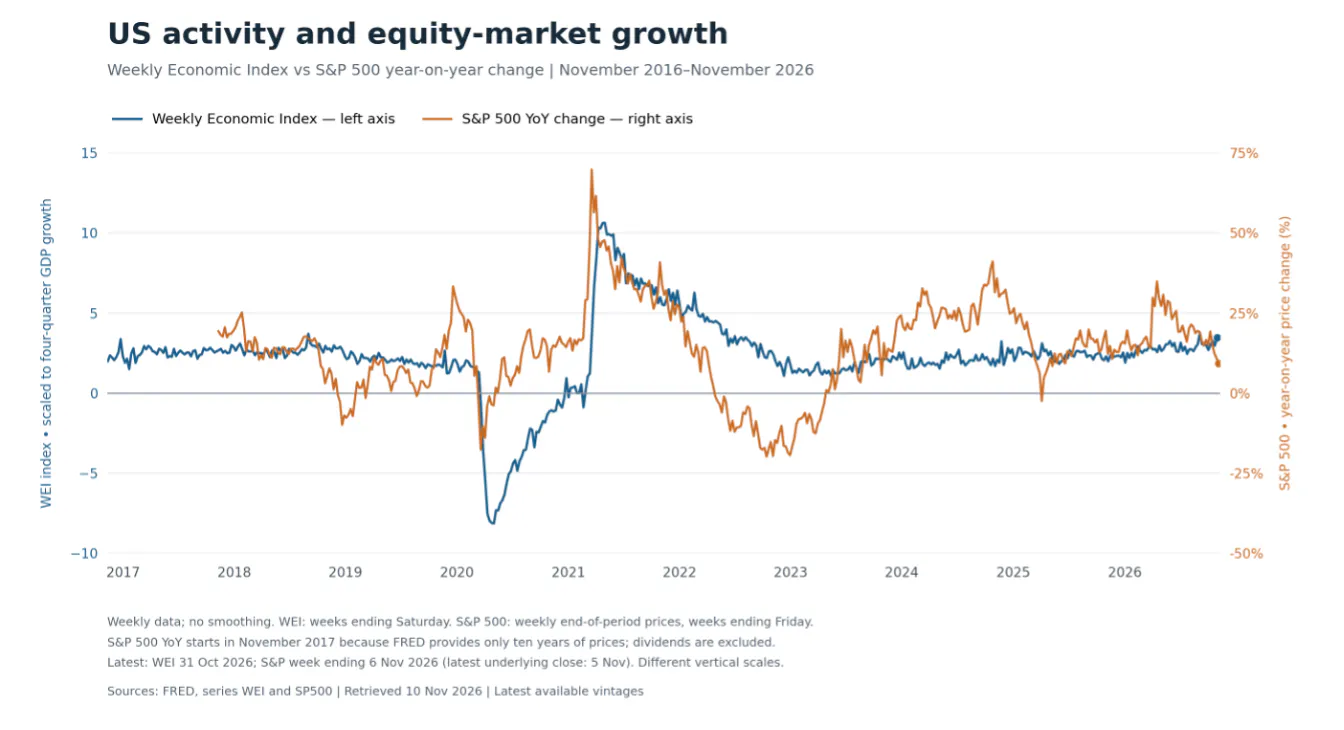
Next came a ten-year comparison of WEI and the S&P 500’s year-on-year price change. The native FRED graph tool produced the comparison. A follow-up request, however, exposed a limitation:
“Can you put the S&P 500 on the right-hand axis?”
The axis-setting parameters we tried were rejected by the tool interface available in that session. We could create the graph, but could not make that particular formatting adjustment through those calls.
This is an important distinction. It was not evidence that FRED charts cannot use a right-hand axis. FRED’s documentation explicitly describes left- and right-axis support. The limitation arose in how we attempted to access that capability through the integration.
For an analyst, the practical question is what happens next. Does the workflow stop, or can the same workbench take another route?
Retrieve the data, then build the chart in Python
The solution was to fetch the underlying observations and use CountryRisk.io Insights’ built-in code interpreter to construct the chart.
We retrieved WEI at its weekly frequency and requested the S&P 500 as weekly end-of-period observations transformed into year-on-year percentage changes. Python then plotted WEI on the left axis and the S&P 500 on the right. The output included a chart image, a vector version and a CSV of the plotted data.
This is a documented part of the Insights workflow: its integrated code interpreter can generate and execute Python for chart creation, while allowing users to inspect the code.
The custom chart also made methodological choices visible. It labelled the two axes separately, aligned their zero levels and explained the shorter coverage of the S&P year-on-year series. Separate axes improve readability, but the apparent similarity of two lines still depends partly on the chosen scales. They are a visual comparison, not evidence of a causal relationship.
More control over the final output
The custom Python chart: WEI on the left axis; S&P 500 year-on-year price change on the right. Weekly data, with distinct observation dates retained. The S&P line starts in November 2017 because FRED’s ten-year price history supplies only nine years of annual changes. Dividends are excluded.
Custom charting also means consistent branding
Once chart construction moves into the code interpreter, the analyst gains control over more than axis placement. Colours, fonts, line weights, gridlines, legends, titles and source notes can follow an organisation’s chart standards. CountryRisk.io’s documented chart workflow supports defined style guides and reusable templates, including specifications embedded in the generated Python code.
A user can therefore ask:
“Use our corporate colours and typography, place the legend above the chart, retain the source note, and export a vector version.”
For research teams, the benefit is consistency rather than decoration: charts prepared by different analysts can follow the same presentation rules without repeated manual reformatting. Shared templates can capture both the analytical steps and the styling conventions.
One workbench, more than one route
This exercise moved from an ambiguous indicator request to a native FRED chart, then to a growth dashboard and finally to a customised dual-axis comparison. The point is not that one charting method is always superior.
Use the provider’s native tools when they answer the question efficiently. Retrieve the data and use the code interpreter when the analysis or presentation requires more control.
That is the value of bringing multiple data providers into CountryRisk.io Insights: access becomes part of a broader research process, alongside analysis, visualisation and writing. Public and proprietary datasets can be used in the same environment, with source references and reusable workflows supporting the work.
The analyst’s responsibilities remain unchanged. Units, vintages, missing observations and revisions still matter; FRED itself cautions that observation dates are not publication dates and that economic statistics can change after their initial release.
The aim is not to automate those responsibilities away. It is to spend less time moving data between tools—and more time deciding what the evidence actually says.