InsightsFrom One Country to the Entire EU: Debt Sustainability Analysis Through the CountryData.io MCP
From One Country to the Entire EU: Debt Sustainability Analysis Through the CountryData.io MCP
Discover how CountryData.io’s MCP connects data, debt models and AI assistants to turn complex fiscal questions into actionable analysis.
Bernhard Obenhuber Oct 29, 2026
In our first introduction to the CountryRisk.io DSA Toolkit, we used Mexico to demonstrate a programmable approach to sovereign debt analysis. The toolkit combined deterministic projections, stochastic simulations and fiscal scenarios in Python, with data supplied through CountryData.io.
The next step is now working: the CountryRisk.io DSA engine can be called through the CountryData.io Model Context Protocol (MCP) interface. An analyst can ask an AI assistant to retrieve data, configure a country project, run scenarios and assemble the results. The assistant coordinates the workflow; the analytical engine calculates the debt dynamics.
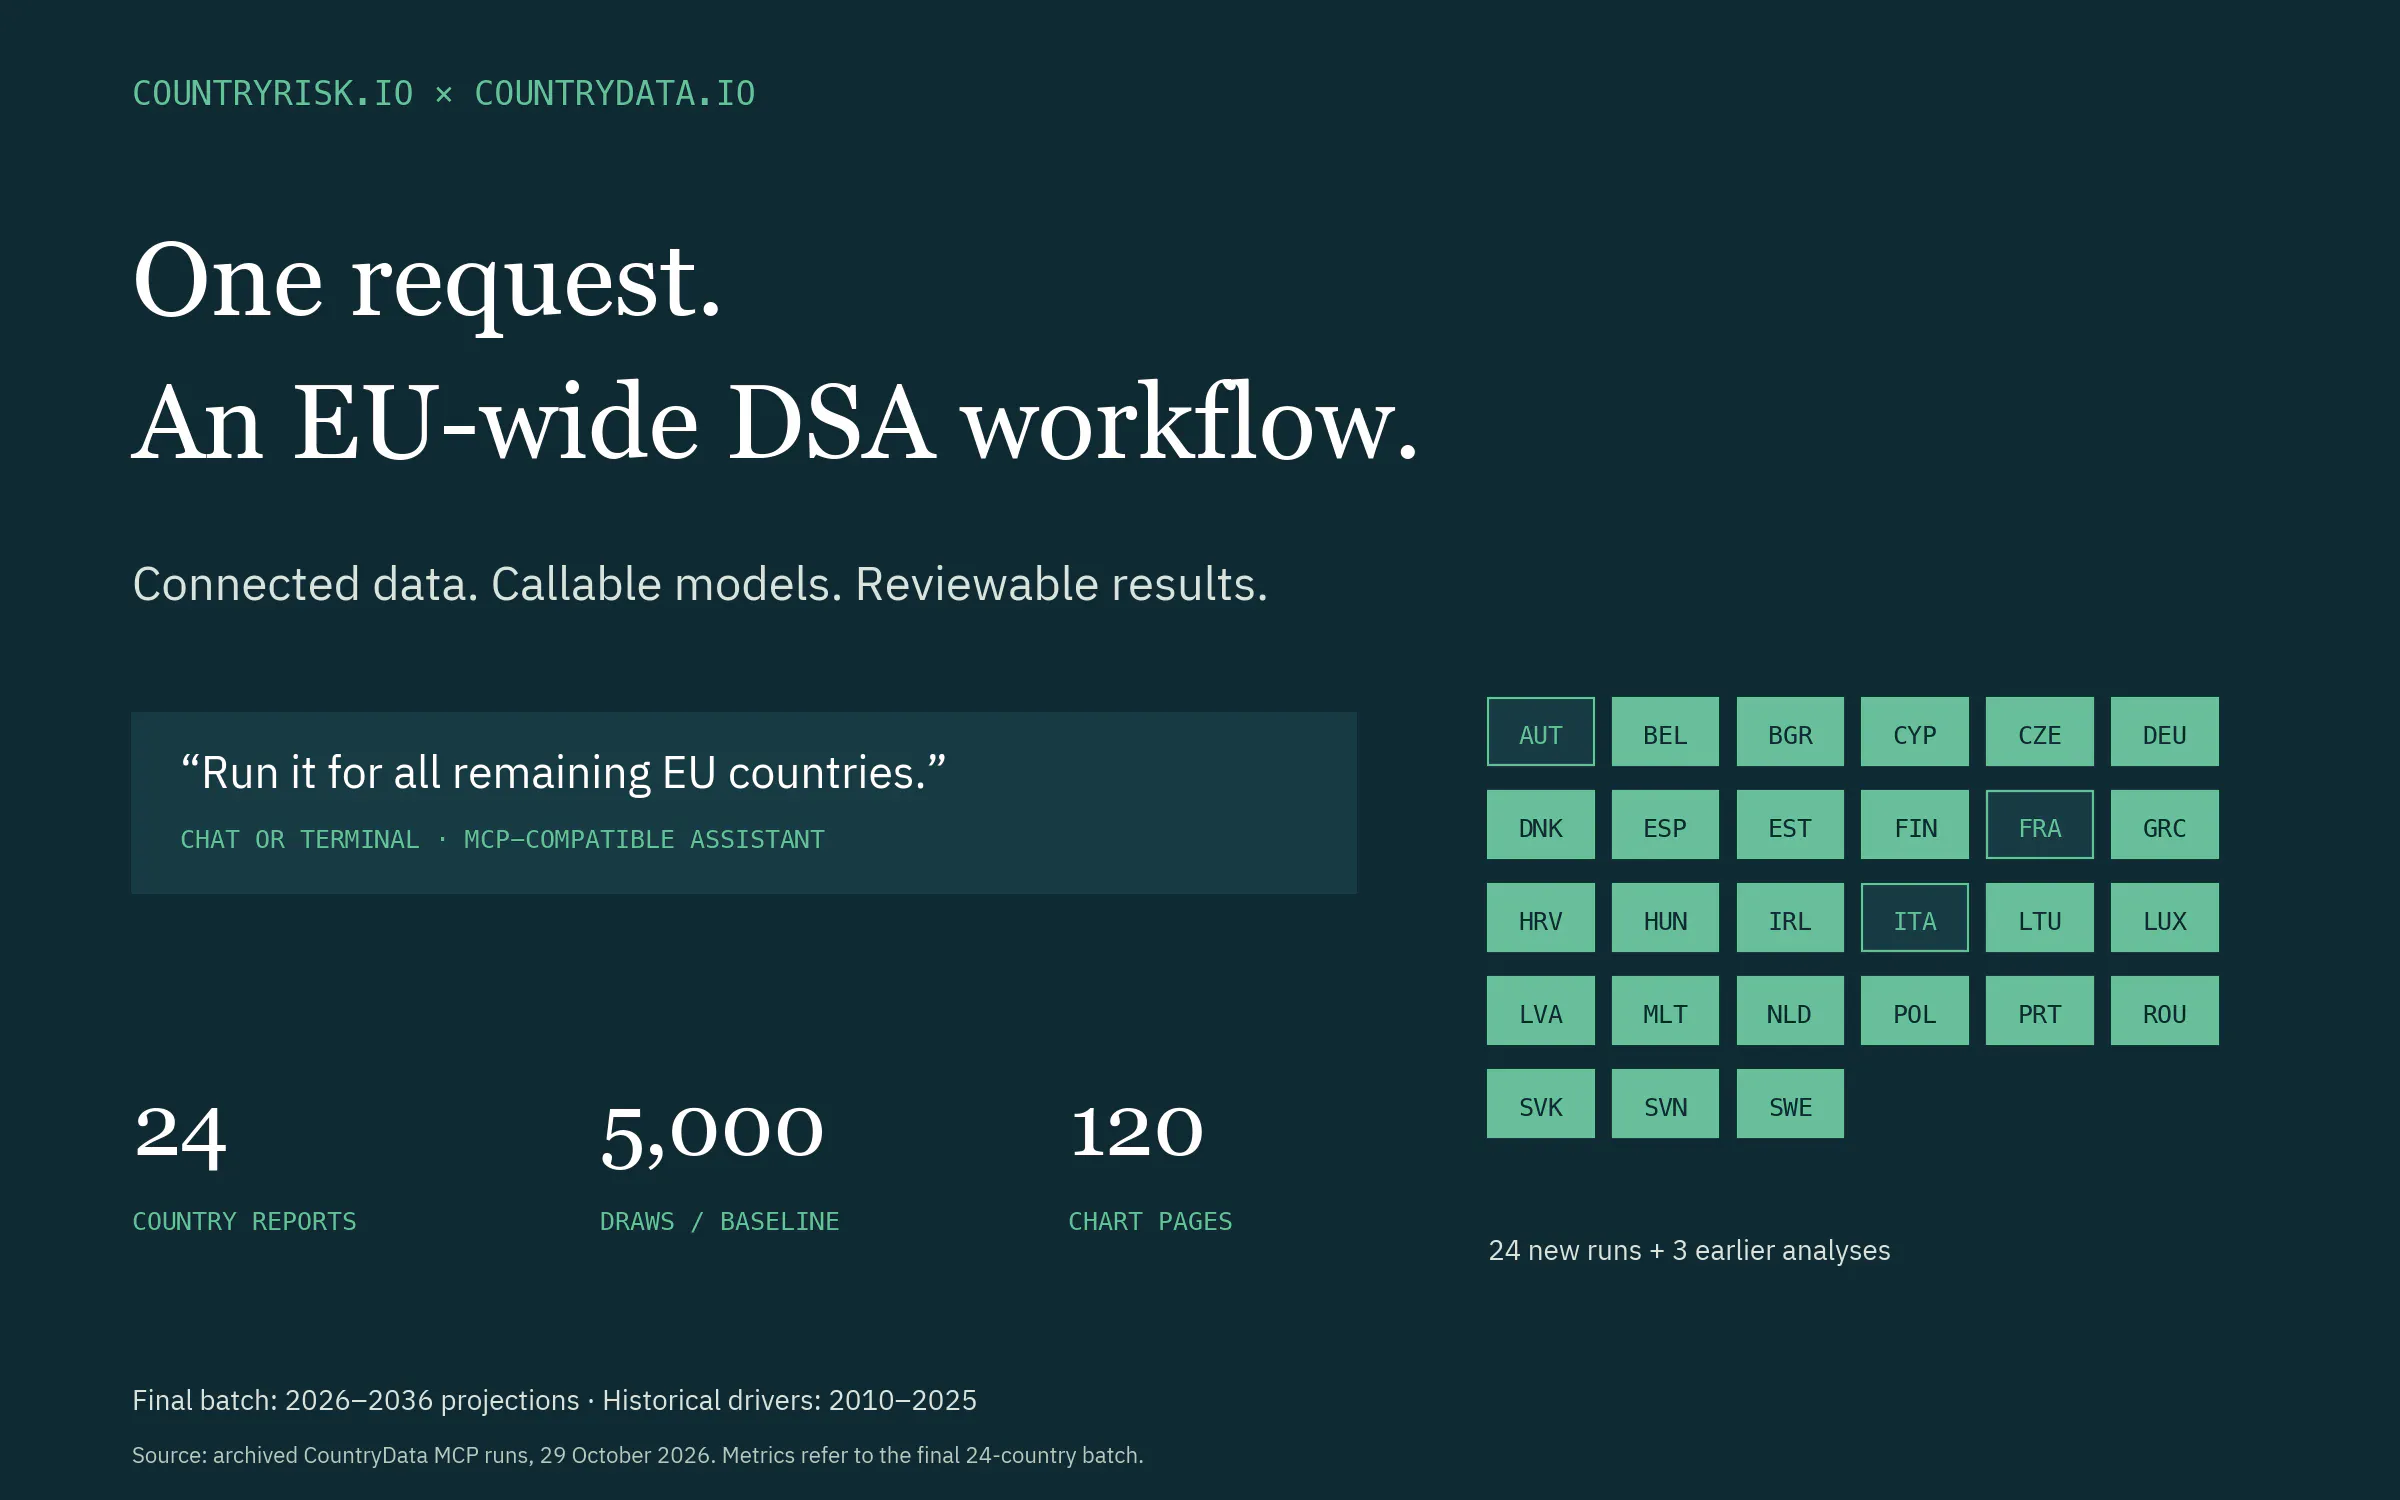
We recently used that connection to extend an analysis from individual countries to all 27 EU members. After completing Italy, France and Austria, the next instruction was simply:
Run it for all remaining EU countries.
That request initiated a further 24 country analyses, each with a deterministic baseline, stress scenarios, stochastic results and historical and projected debt-driver charts. It is a practical demonstration of what becomes possible when the data and the model are accessible through the same analytical interface.
The toolkit is a collaboration with Lennard Welslau, Julián Szymanski and Mathias Fussenegger.
What the MCP makes possible
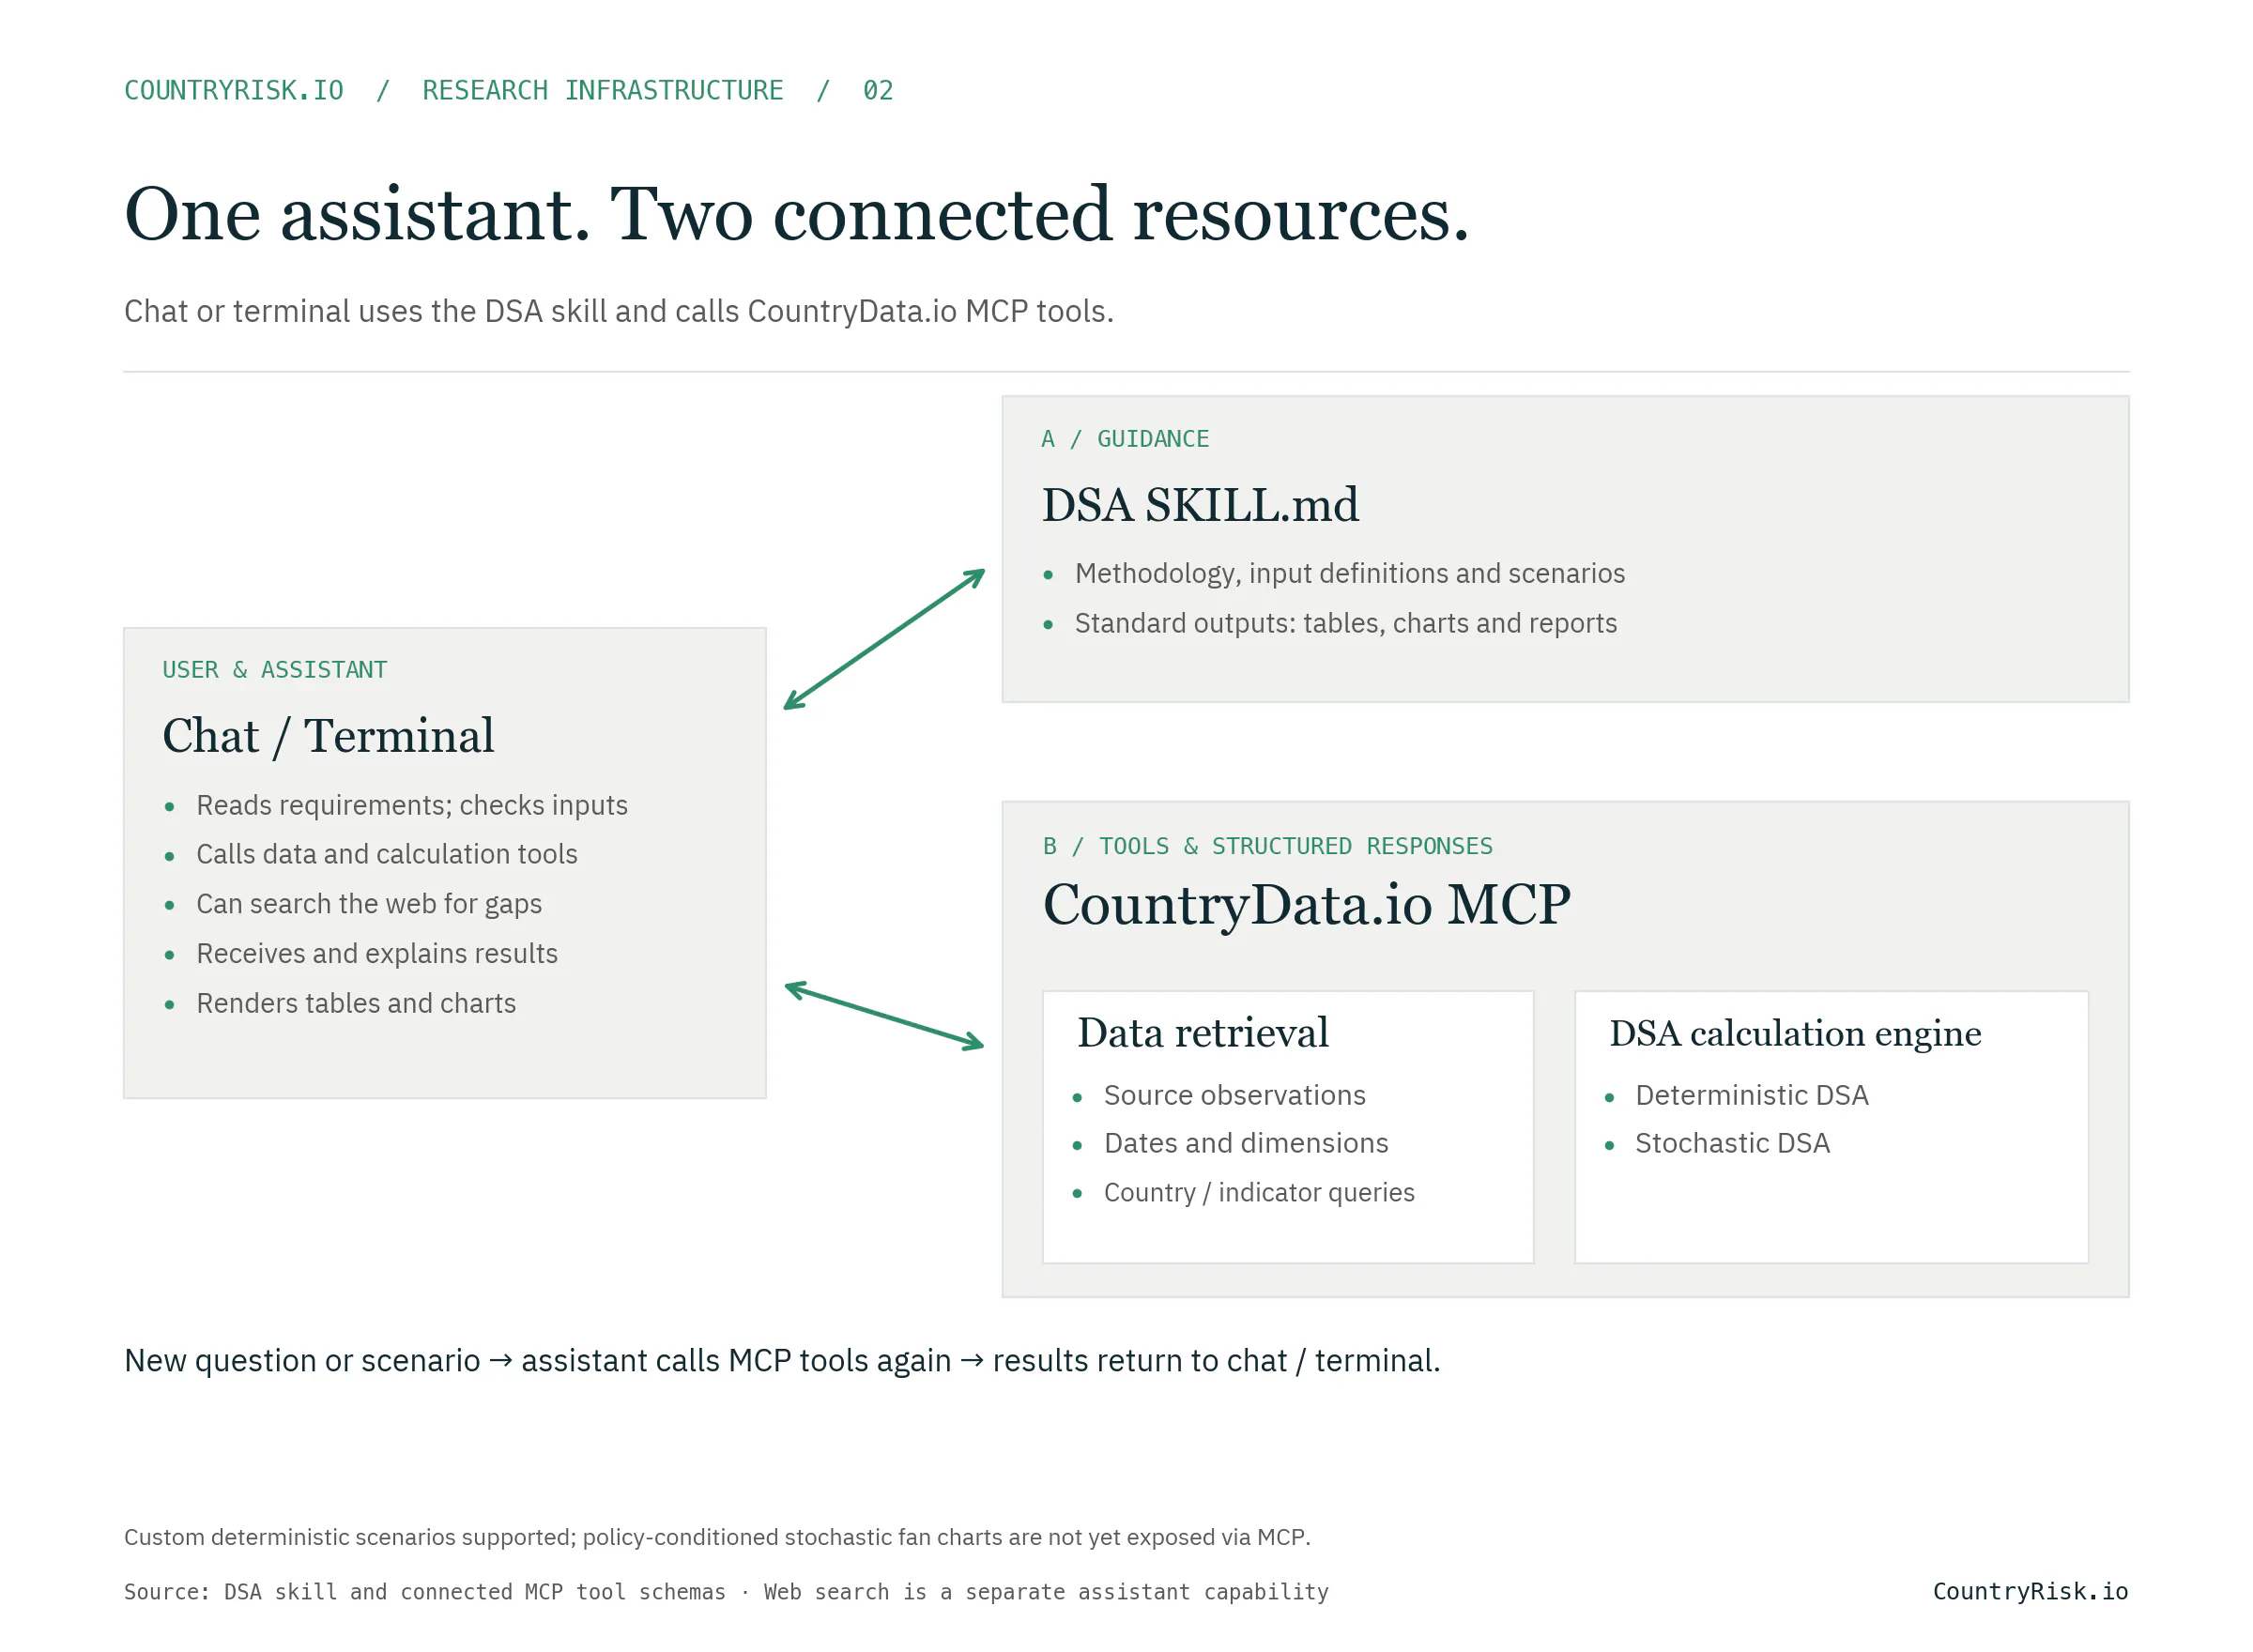
MCP gives a compatible AI assistant access to tools with defined inputs and structured responses. In this workflow, those tools expose both CountryData.io data retrieval and the CountryRisk.io DSA engine.
The MCP can be used from any compatible AI application that supports MCP connections, including chat interfaces and terminal-based coding assistants. The accompanying SKILL.md provides methodology, input guidance and scenario-building instructions to help the assistant run and interpret DSAs consistently.
The distinction matters. A request such as “show what happens if borrowing costs rise” is translated into explicit model parameters: the country project, the rate shock, its size and the years it applies. The service returns numerical results that can be inspected, compared and plotted.
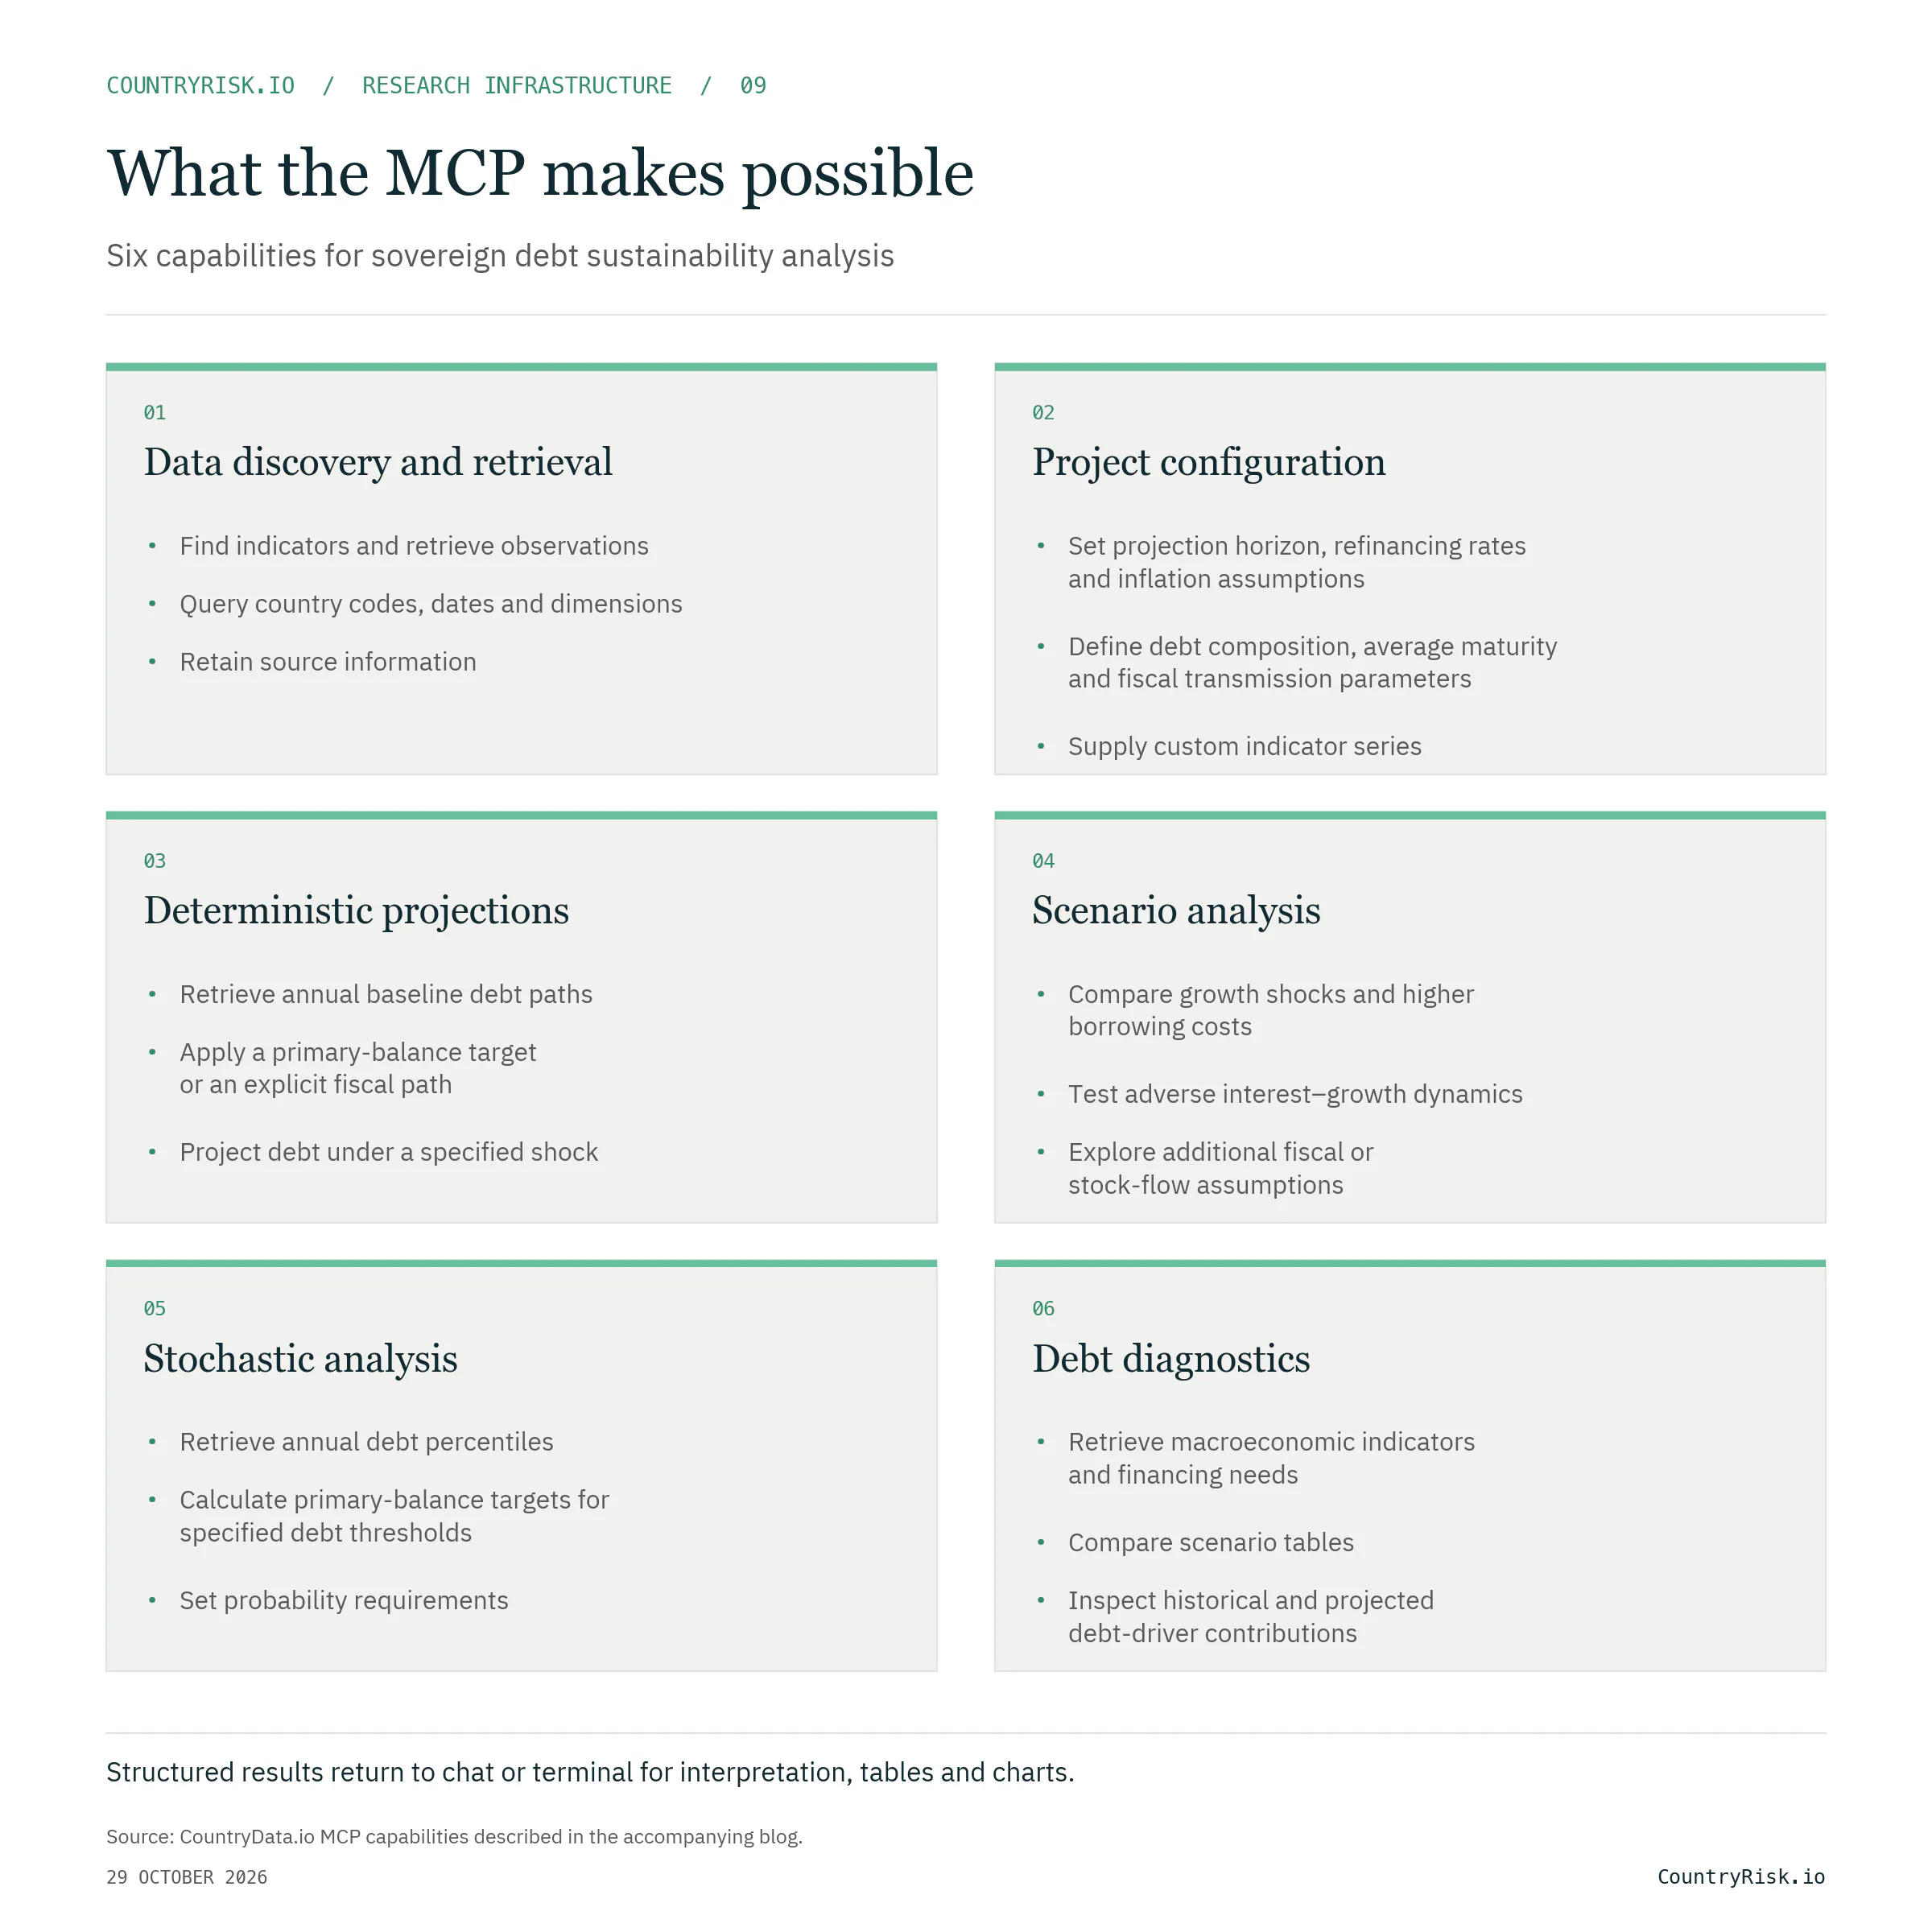
The connected interface currently supports:
These responses are machine-readable. An assistant or reporting application can use them to build comparison tables, charts and reports without manually transcribing results from a workbook. In our EU exercise, the MCP performed the DSA calculations; local scripts validated the returned data and generated the presentation files.
From a country request to an EU-wide workflow
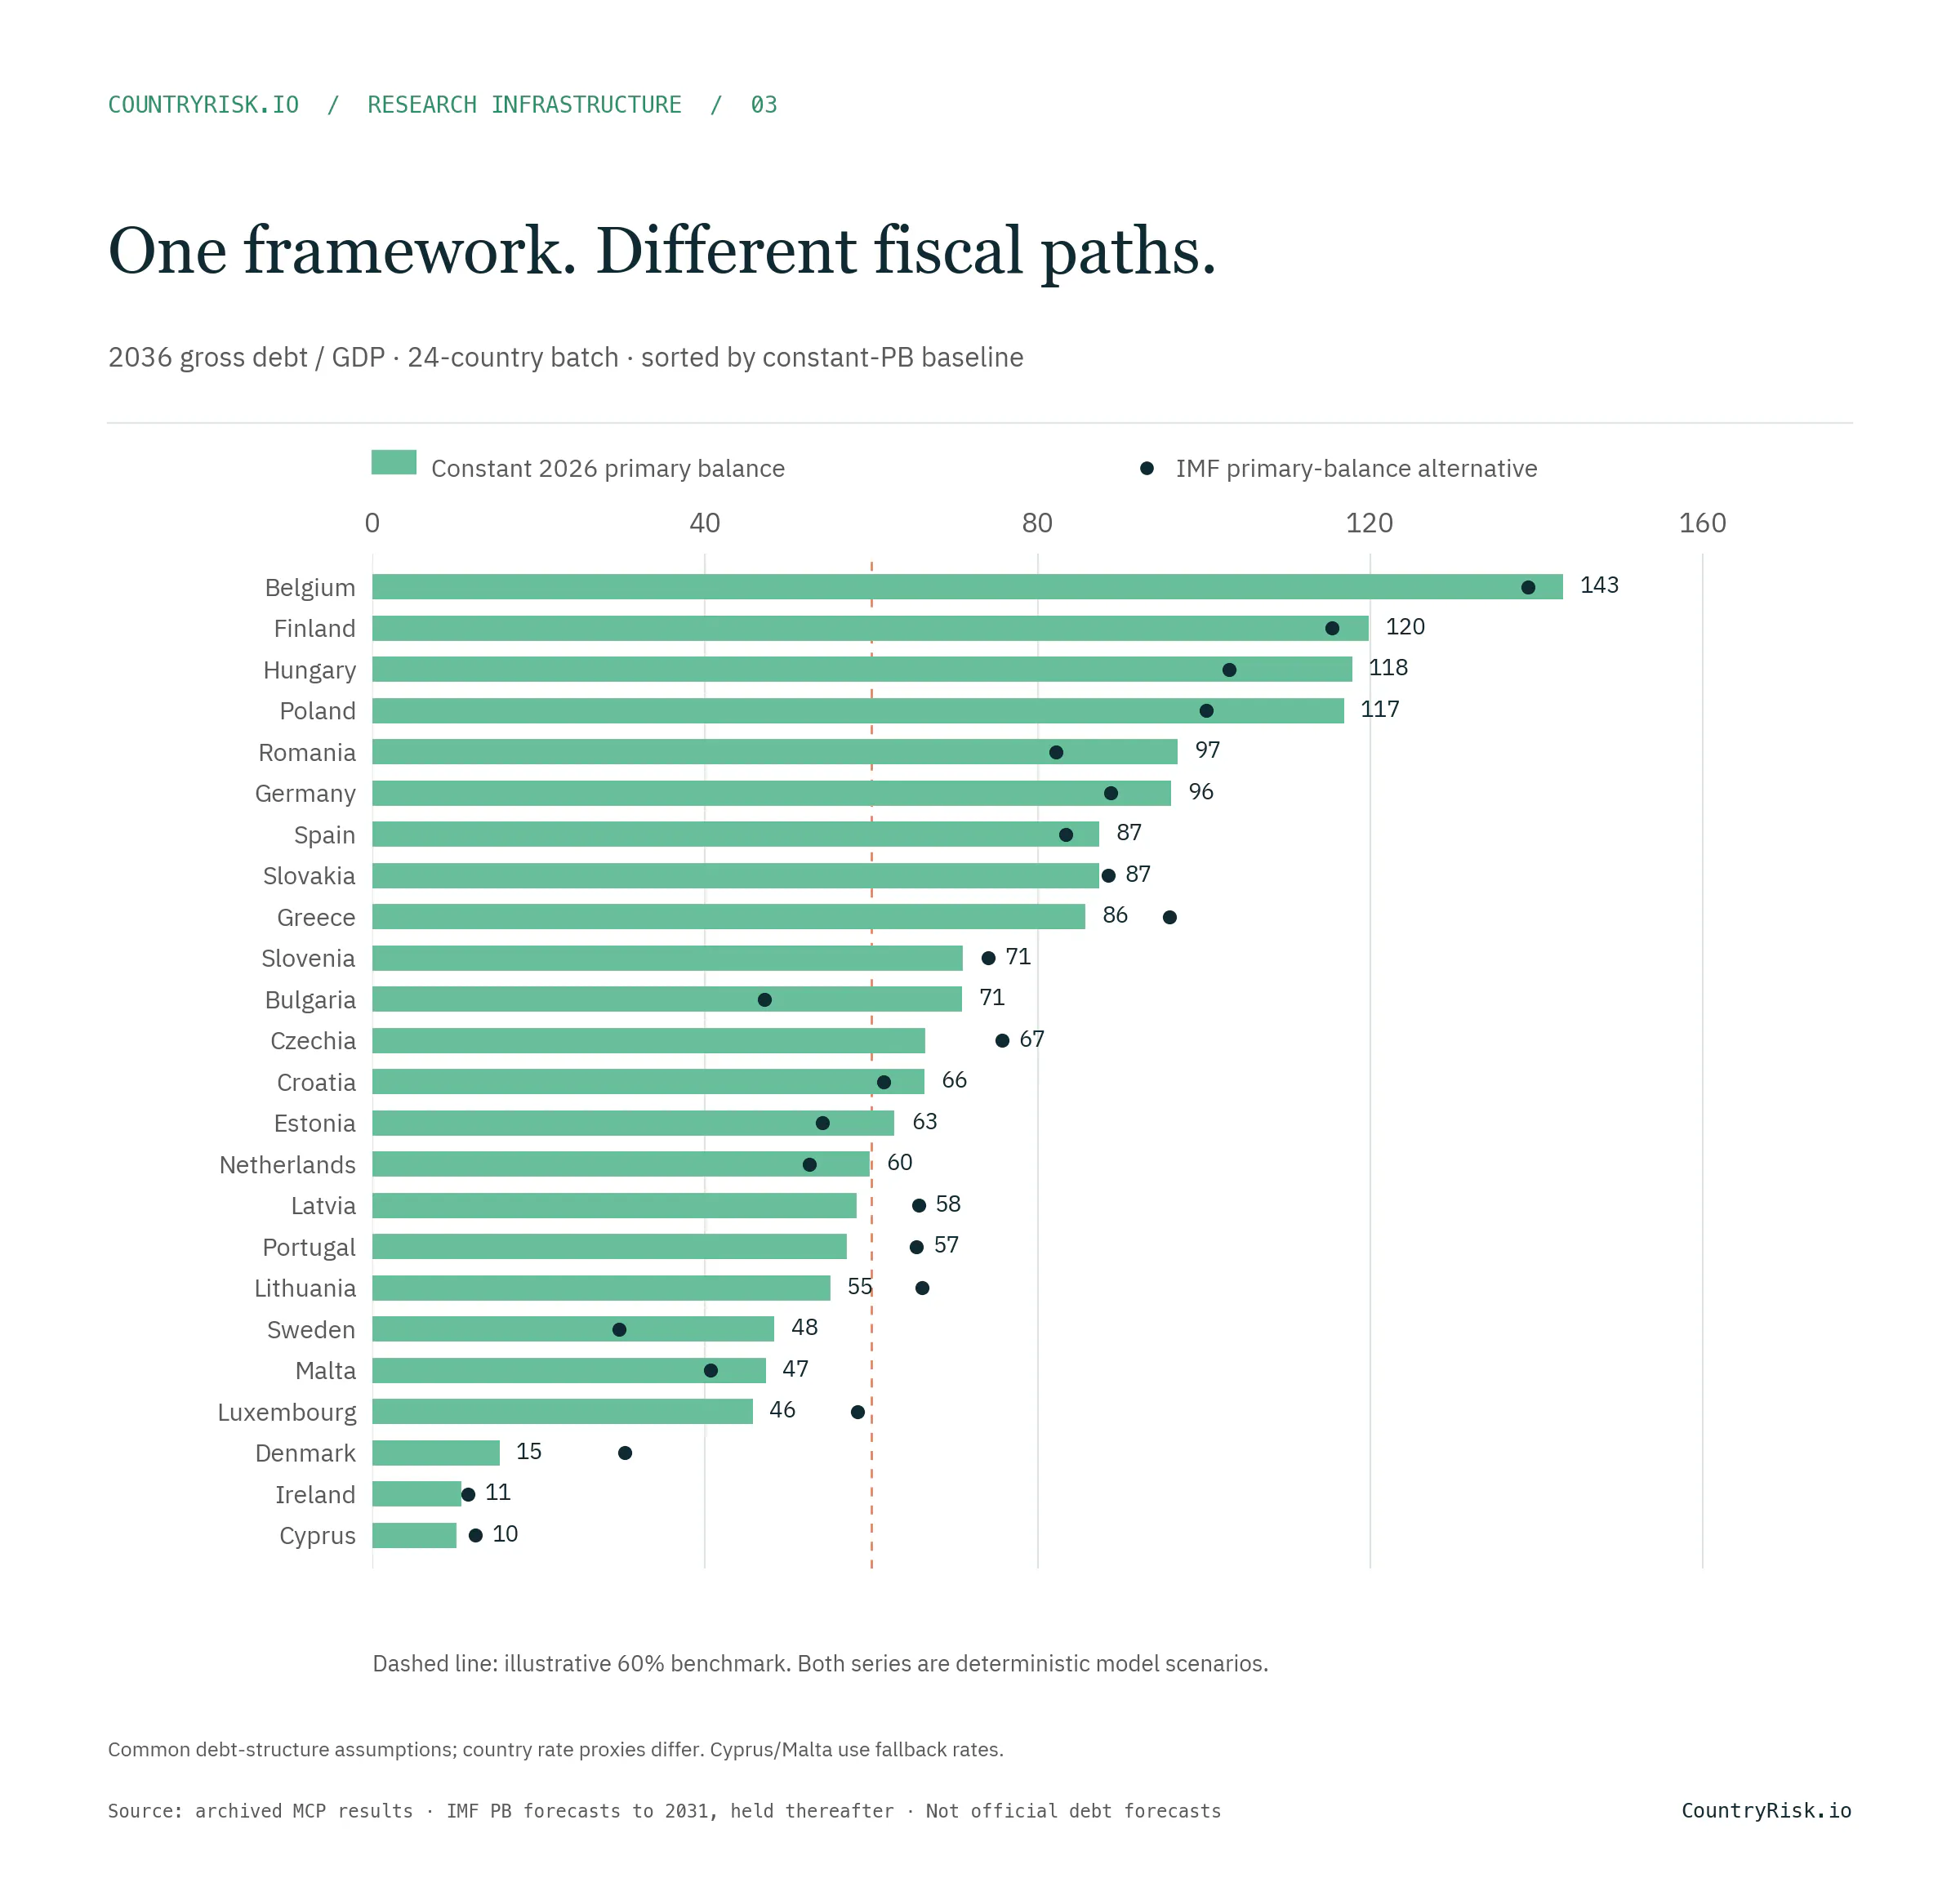
The final 24-country batch used a common 2026–2036 projection horizon, historical debt-driver charts for 2010–2025 and 5,000 simulations per baseline stochastic analysis. Each country received the same core analytical treatment:
A deterministic baseline holding the 2026 primary-balance ratio constant.
An alternative fiscal path using IMF primary-balance forecasts through 2031, then holding the final ratio constant.
Growth, interest-rate and combined macroeconomic stress scenarios.
Additional fiscal sensitivities, including a gradual primary-balance improvement and a one-off contingent liability.
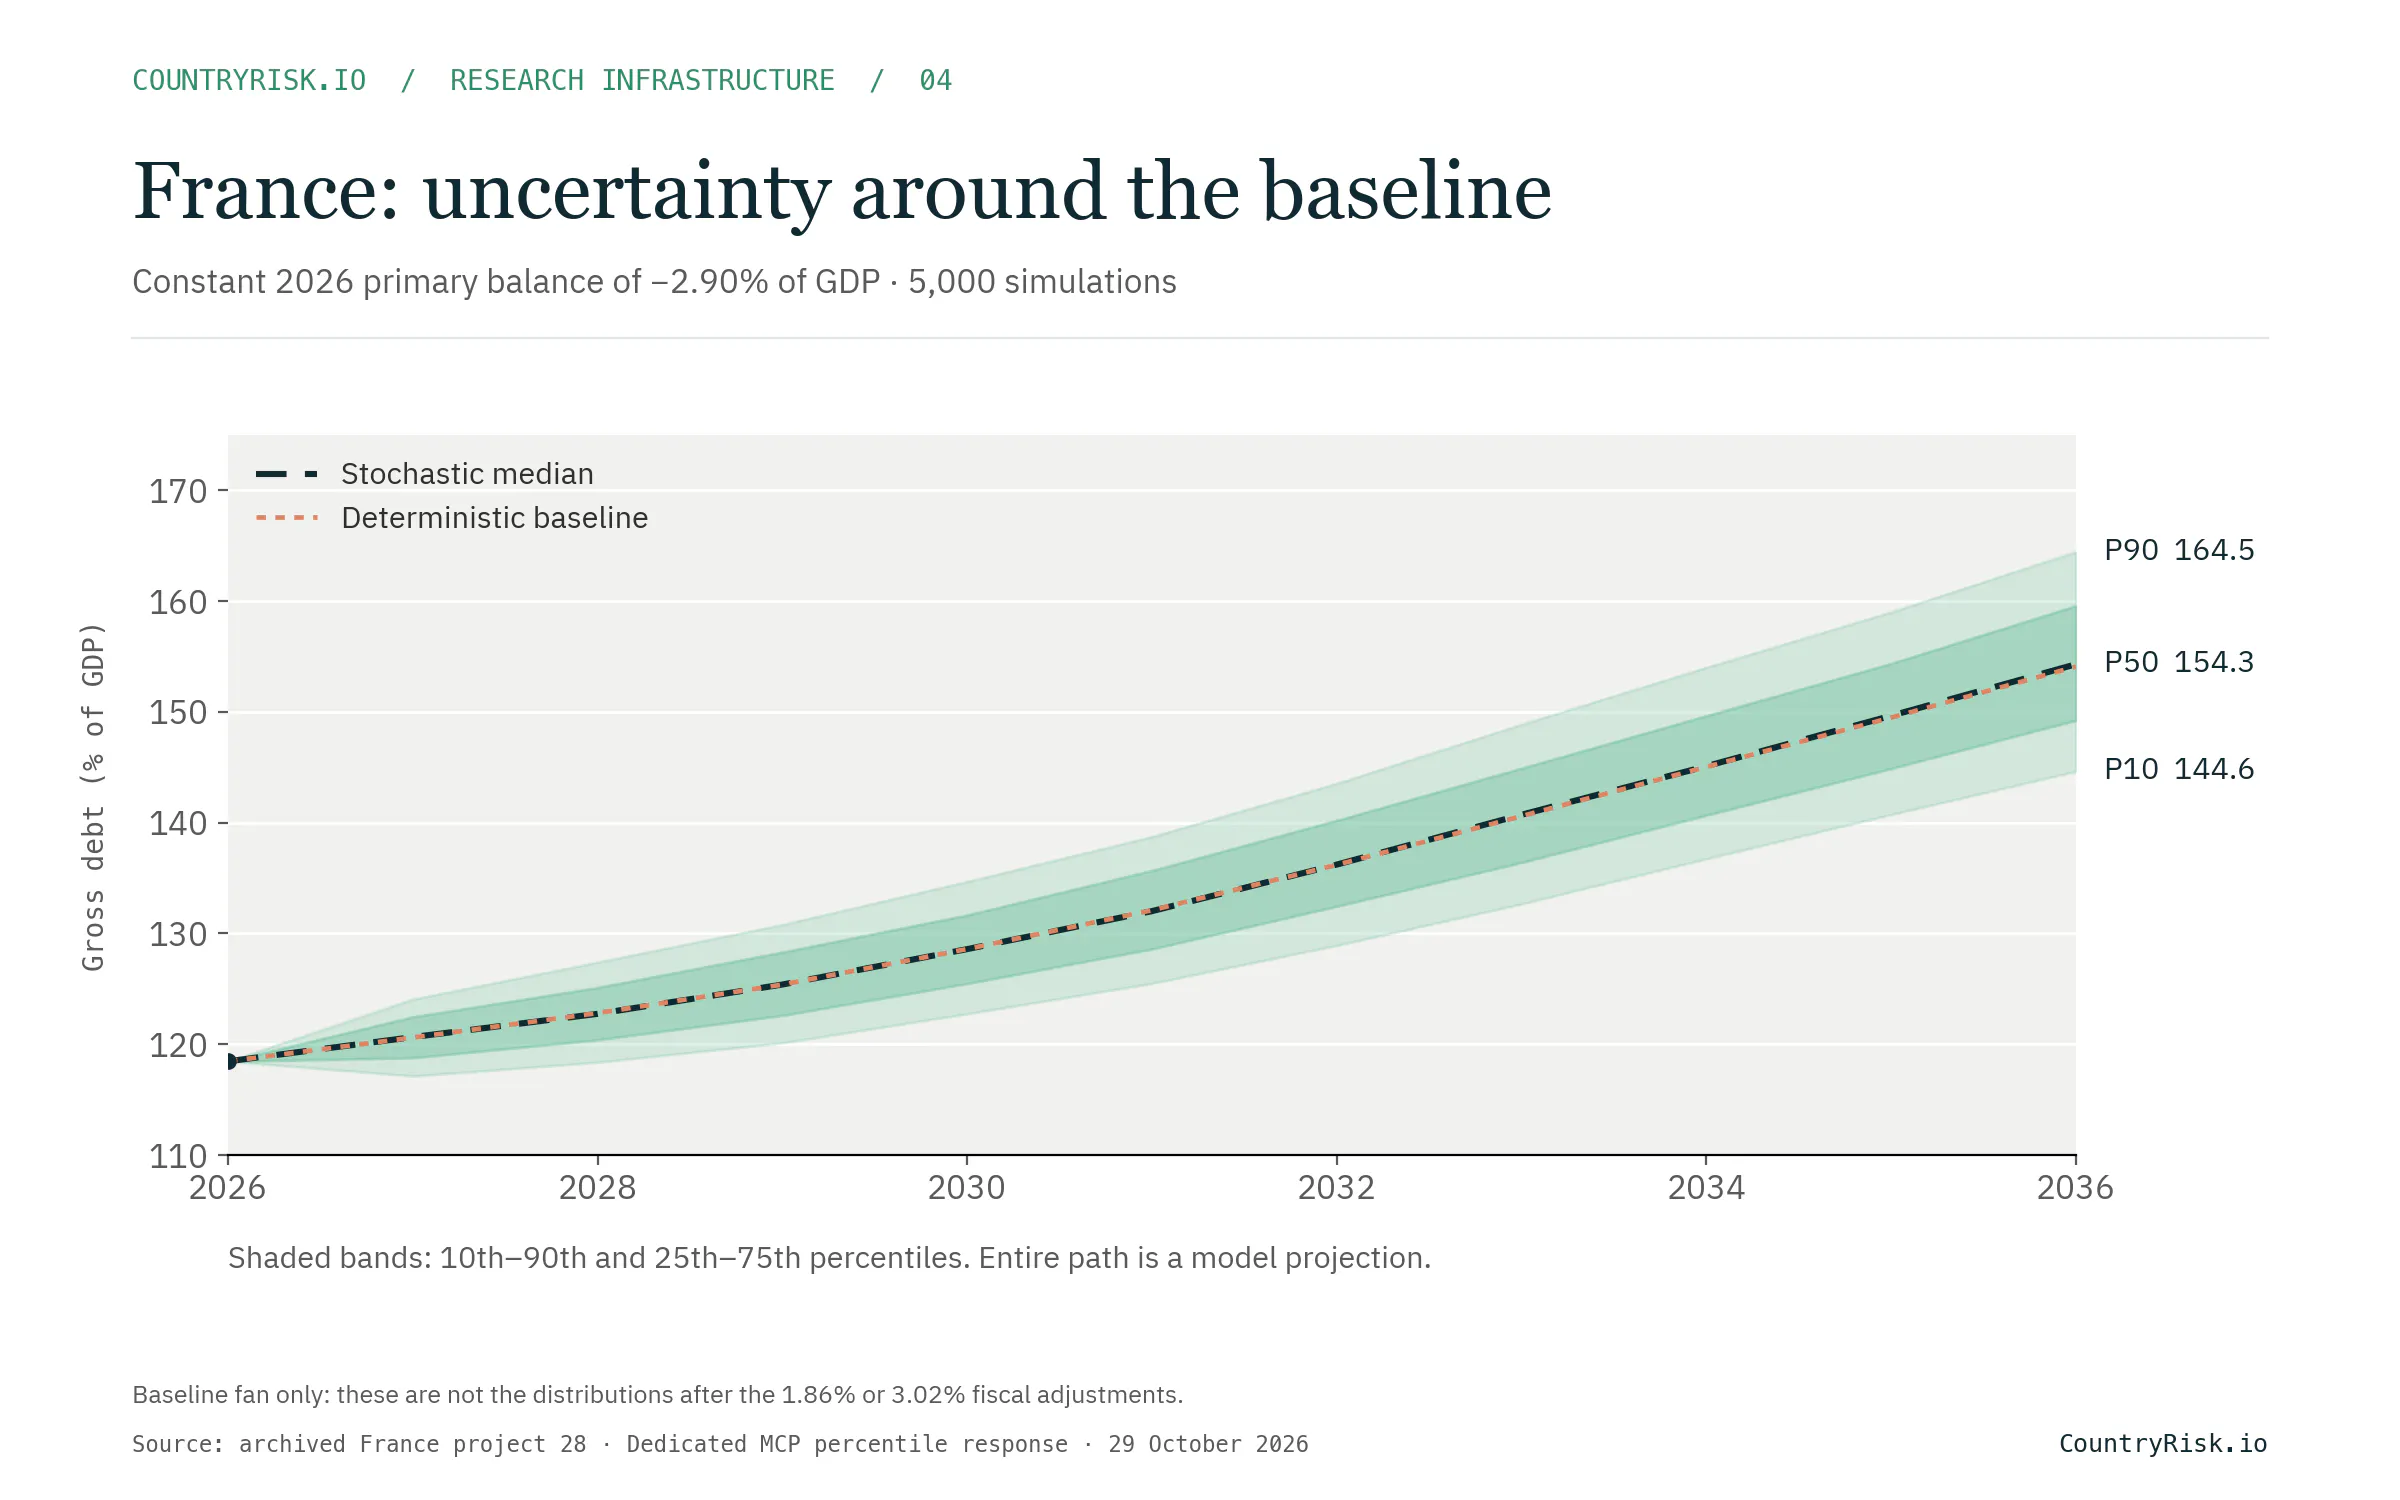
A baseline fan chart, fiscal-target tables and both historical and projected debt-driver charts.
The batch produced 24 country reports and a 120-page chart pack. Behind those outputs were 813 analytical MCP calls and 2,589 passing numerical checks, covering accounting identities, scenario calibration, historical reconciliation and other consistency tests.
The user did not need to specify those calls individually. The workflow handled country iteration, retrieval, scenario execution, validation and file generation. This is where the reduction in operational effort becomes tangible: extending the coverage no longer requires manually rebuilding the analytical process for each country.
It also makes follow-up questions easier. An analyst can move from the EU comparison to France, ask how its baseline primary balance compares with history, extend the historical window from 2010 back to 1990, or ask how a higher probability requirement changes the fiscal adjustment target. Each question builds on identifiable data and model inputs.
The EU exercise demonstrates broad coverage, rather than a definitive country ranking. Italy, France and Austria were completed in earlier runs. The final batch used common benchmark assumptions for maturity and debt composition, while interest-rate inputs differed by country. Those choices remain part of the interpretation.
CountryData.io provides the foundation
Making a model callable is only part of the work. A DSA needs coherent inputs: GDP levels, fiscal balances, debt stocks, inflation, interest rates and historical observations for estimating uncertainty. Preparing those inputs repeatedly across countries can absorb much of an analyst’s time.
CountryData.io connects that preparation to the analysis. In the EU runs, we retrieved IMF macroeconomic and fiscal series and OECD interest-rate observations through the same MCP connection used to access the DSA tools. We could query by country and indicator, inspect available dates and dimensions, and retain the underlying observations alongside the model results.
That creates three practical benefits.
Less repeated data preparation. A common retrieval interface reduces the need to build a separate download and import process for every source or country. The workflow can reuse indicator mappings and input checks across the portfolio.
Traceable assumptions. Source observations can be kept separate from forecasts and analyst choices. For example, a retrieved interest rate can inform the starting calibration, while holding that rate constant over ten years remains an explicit modeling assumption. The historical primary balance can be reconstructed from its numerator and GDP denominator rather than copied from a chart.
A reusable connection between research and calculation. The same data access supports the original DSA, subsequent scenario questions and supporting diagnostics. Extending France’s primary-balance histogram to an earlier period required another data query and a chart update, without reconstructing the entire country analysis.
A common interface does not eliminate data gaps or differences in definitions. Cyprus and Malta, for example, had no observations in the OECD rate series used for the other country calibrations. Their reports explicitly identified the fallback proxies. Likewise, the common domestic-currency debt assumption excluded foreign-currency valuation exposure. The value of the infrastructure is that these choices can be recorded and inspected alongside the results.
France: turning a policy question into a model request
France illustrates how the interface supports a progressively more precise analytical discussion.
The initial question was what primary balance would stabilize debt. But “stabilize” can mean several things: stop debt rising late in the projection, return to the initial debt ratio by a particular year, or meet a ceiling with a specified probability. The workflow lets the analyst define the objective before interpreting the answer.
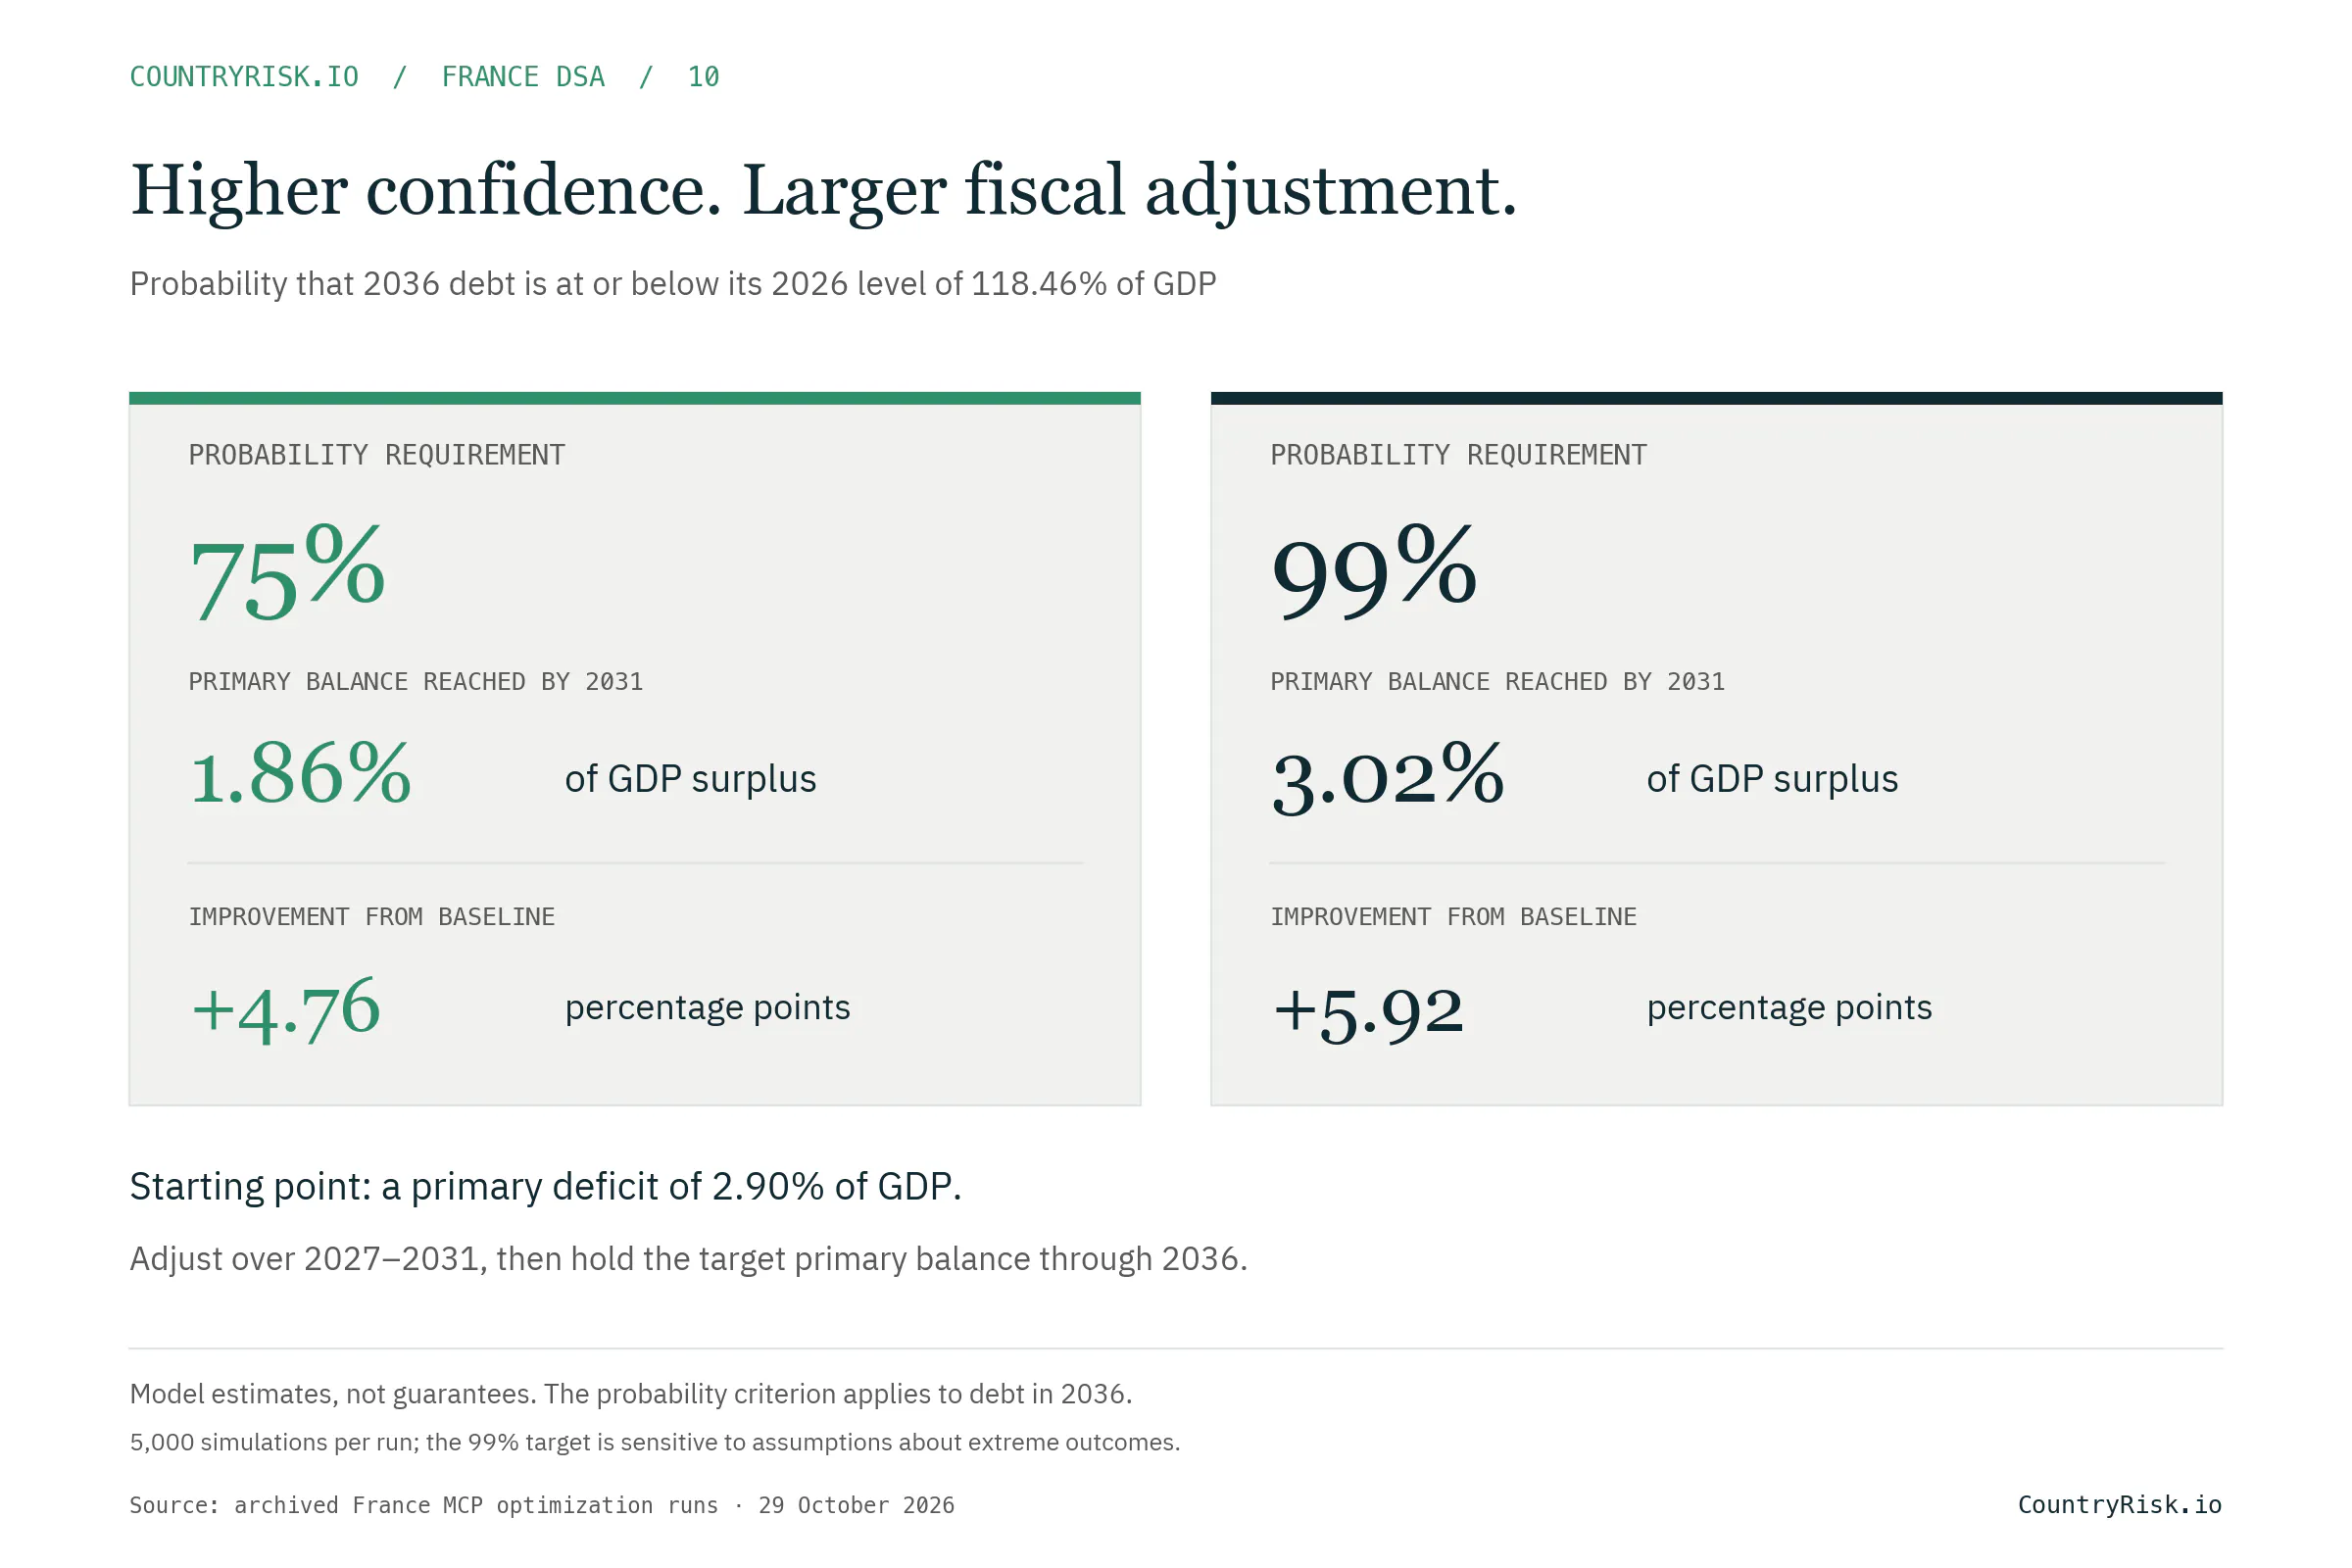
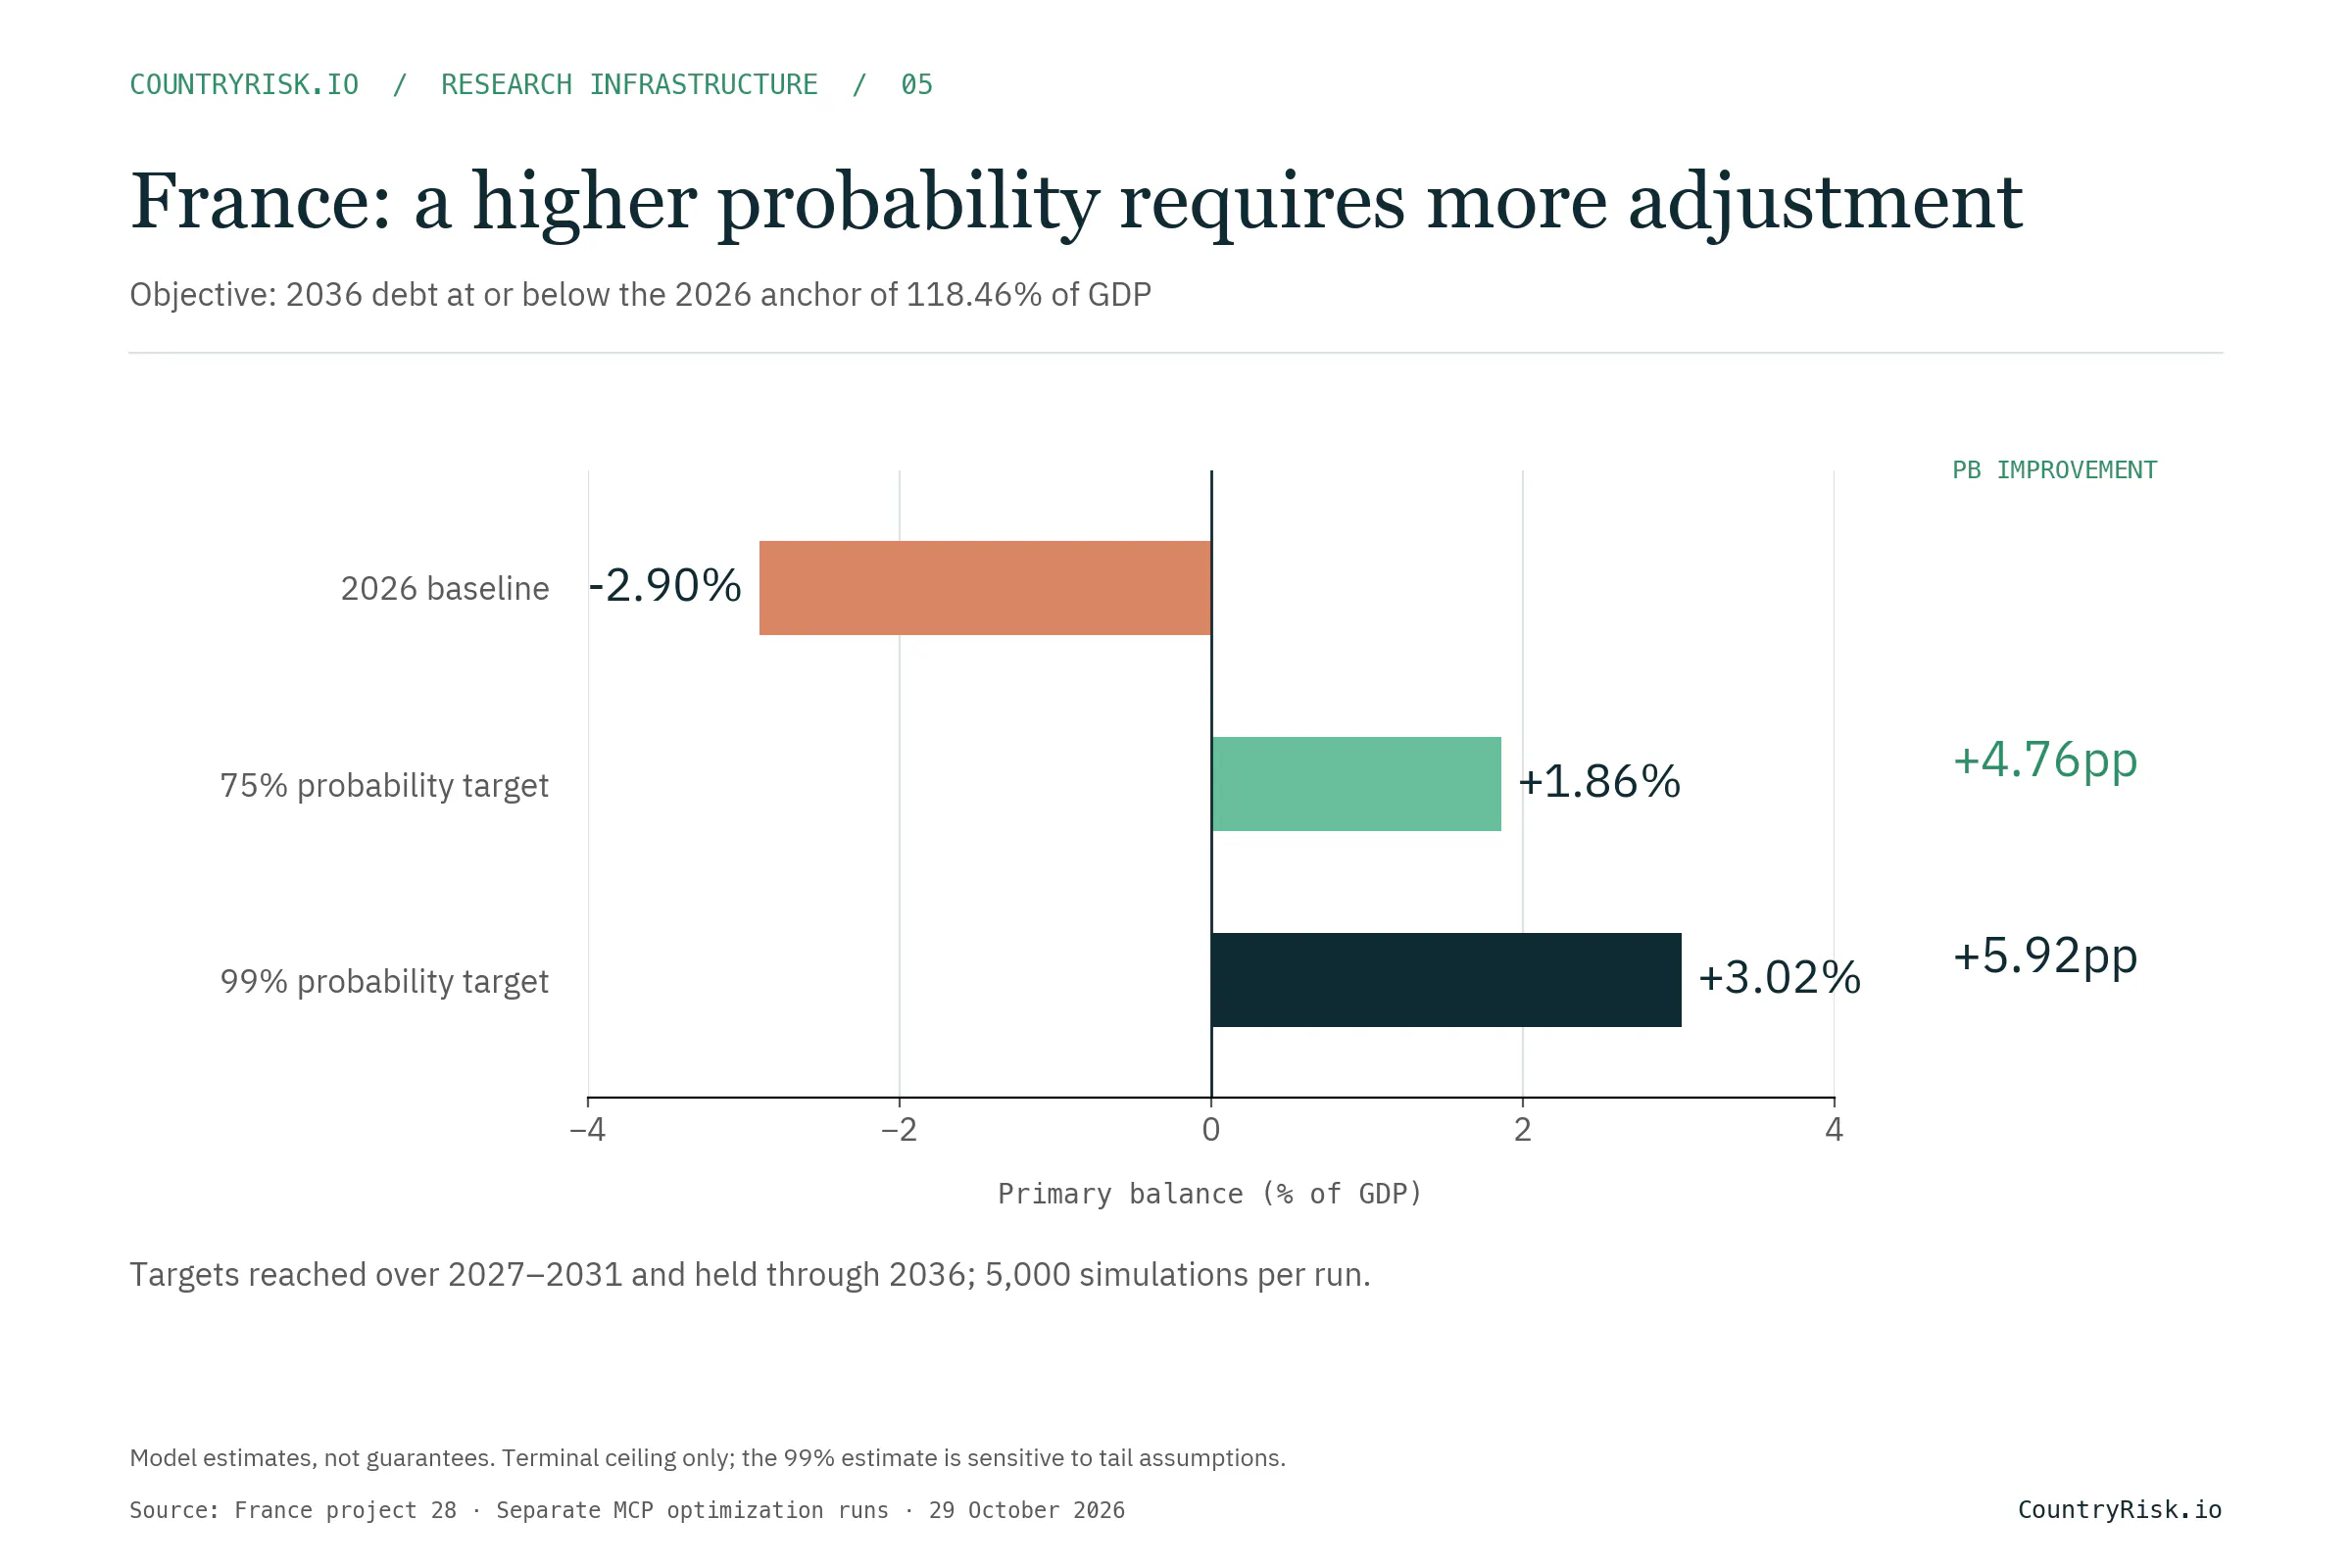
For France, we asked the stochastic model for a primary-balance target that would put debt in 2036 at or below the 2026 anchor of 118.46% of GDP. With a five-year adjustment, the recorded runs returned:
These are conditional model estimates from 5,000 simulations per run. They concern terminal debt, not a ceiling in every intervening year. The 99% estimate is particularly sensitive to tail assumptions and simulation variation; neither figure establishes that the adjustment is politically or economically feasible.
Explaining the debt path
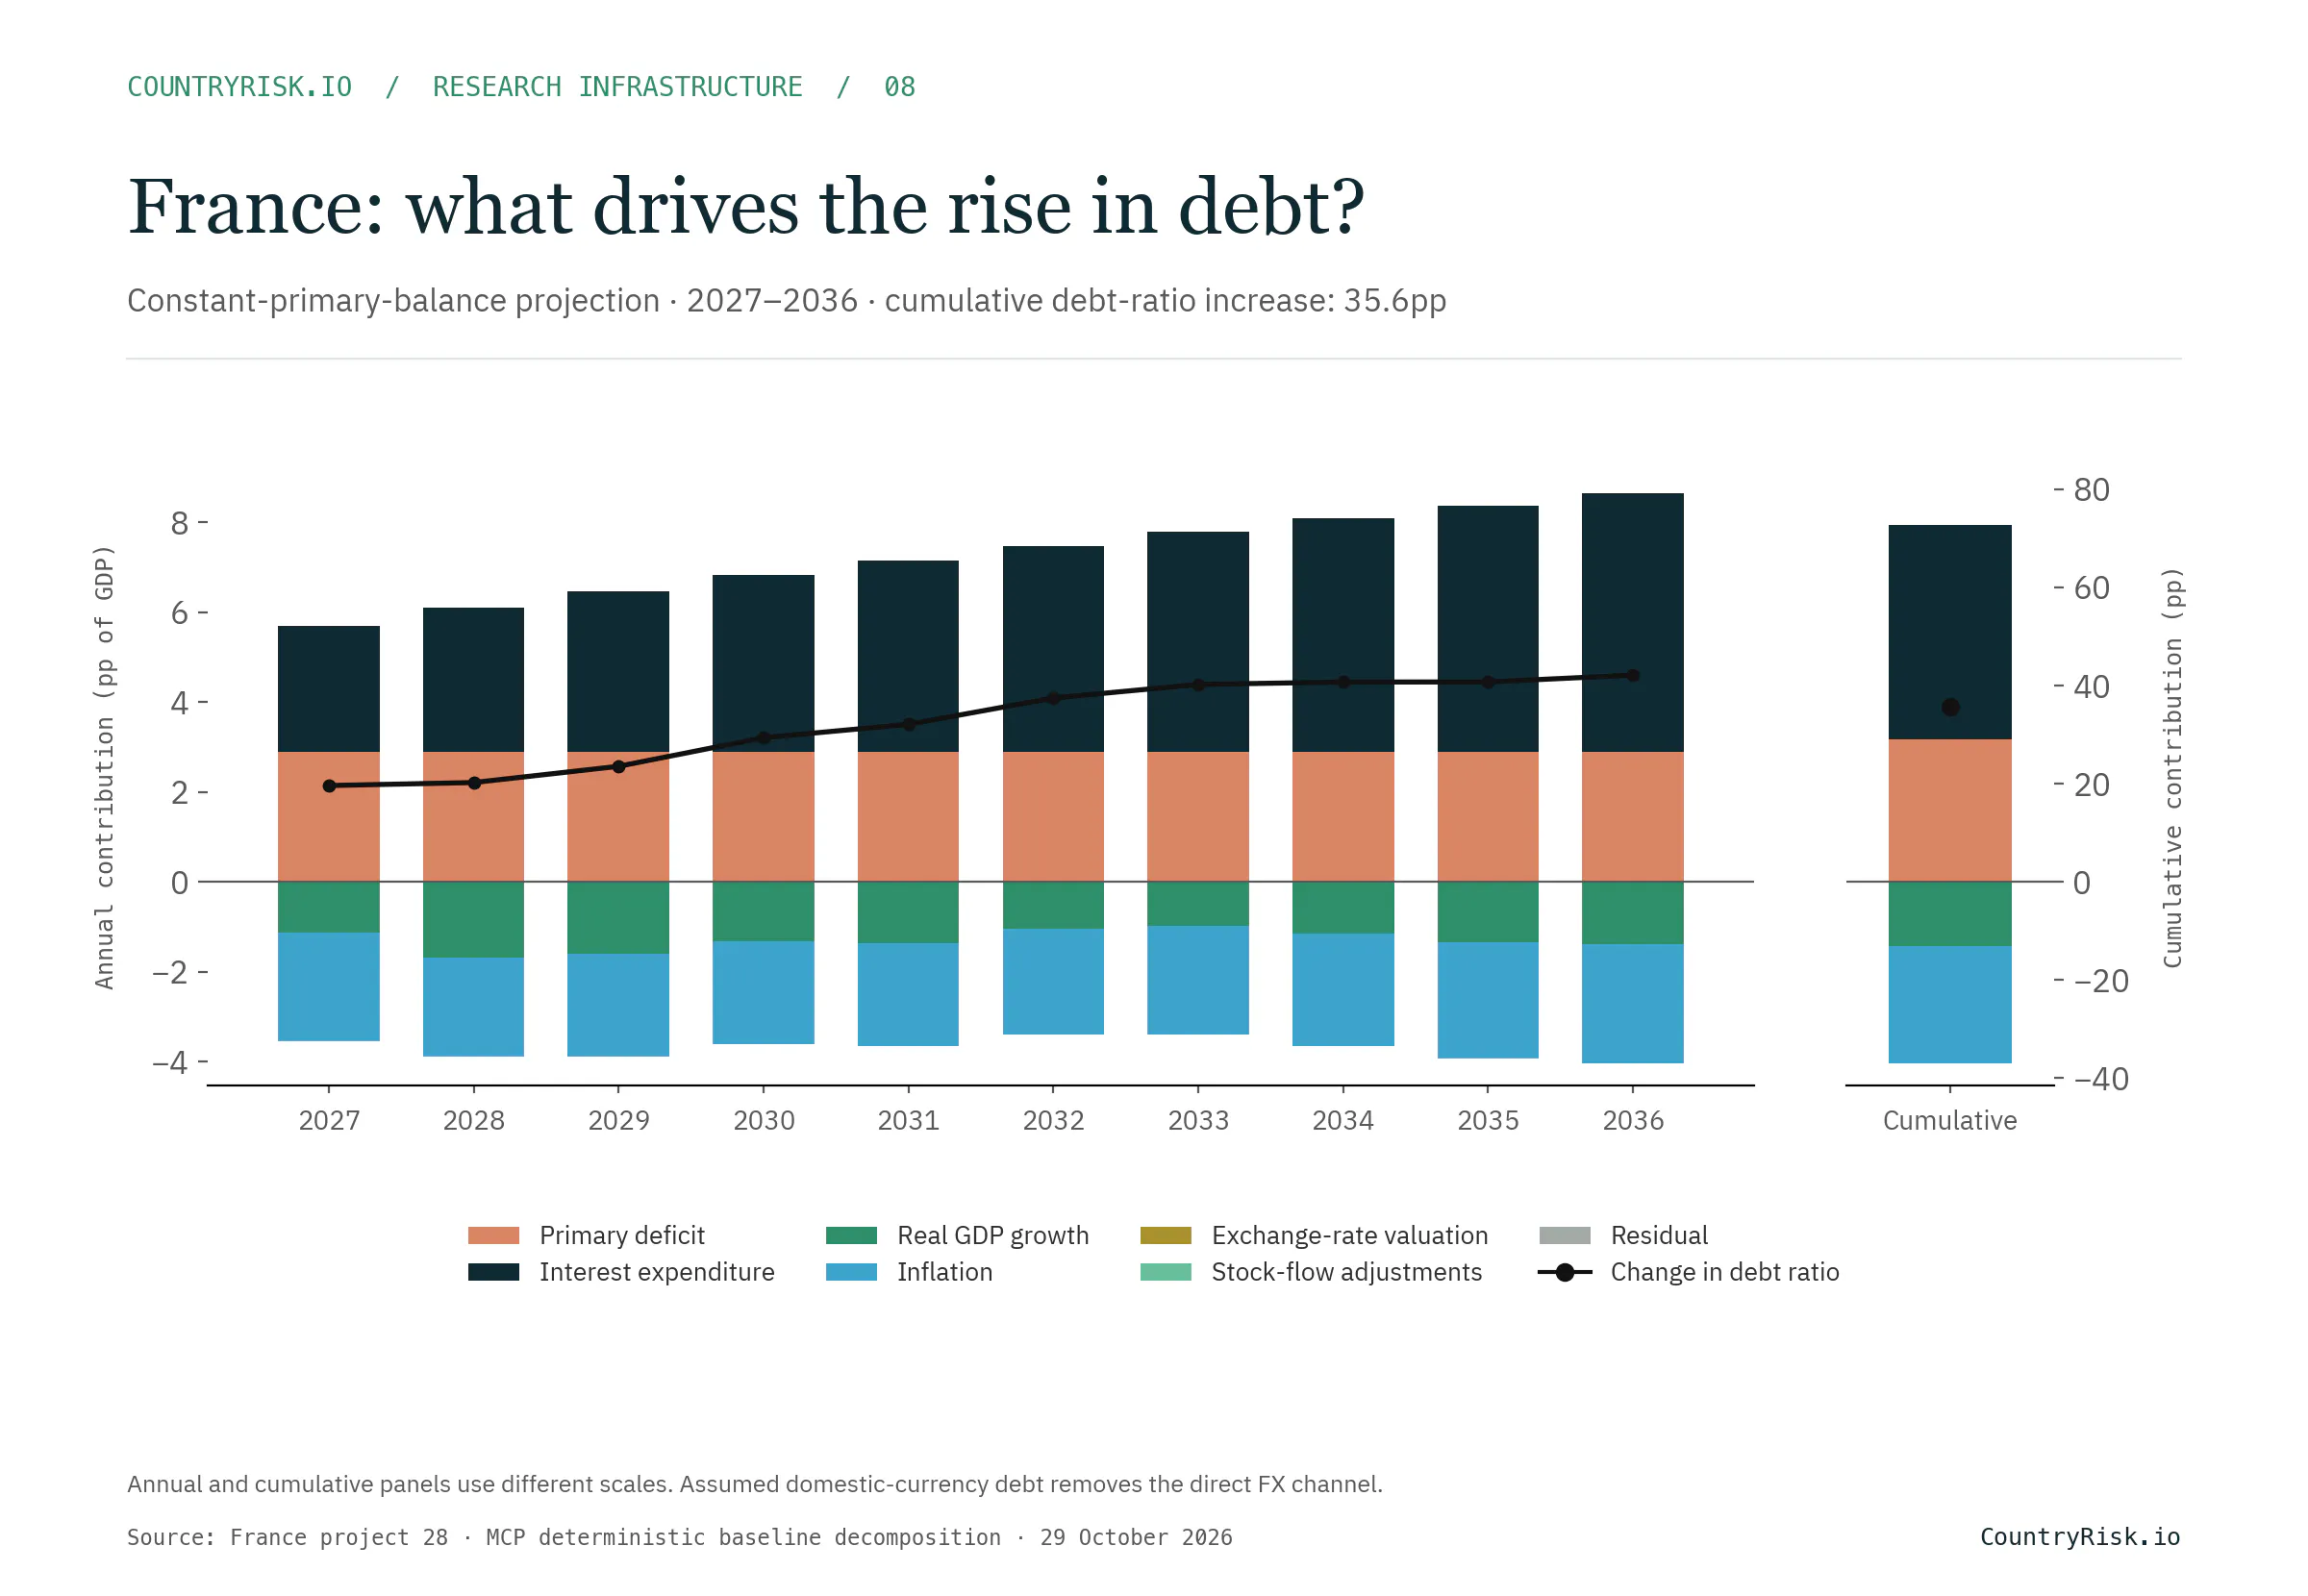
The toolkit also produces debt-driver charts, separating primary deficits, interest expenditure, real growth, inflation, exchange-rate valuation, other stock-flow adjustments and residuals. Through MCP, the engine returns the underlying contributions; the assistant’s reporting code turns them into the standard charts.
How unusual would those primary surpluses be?
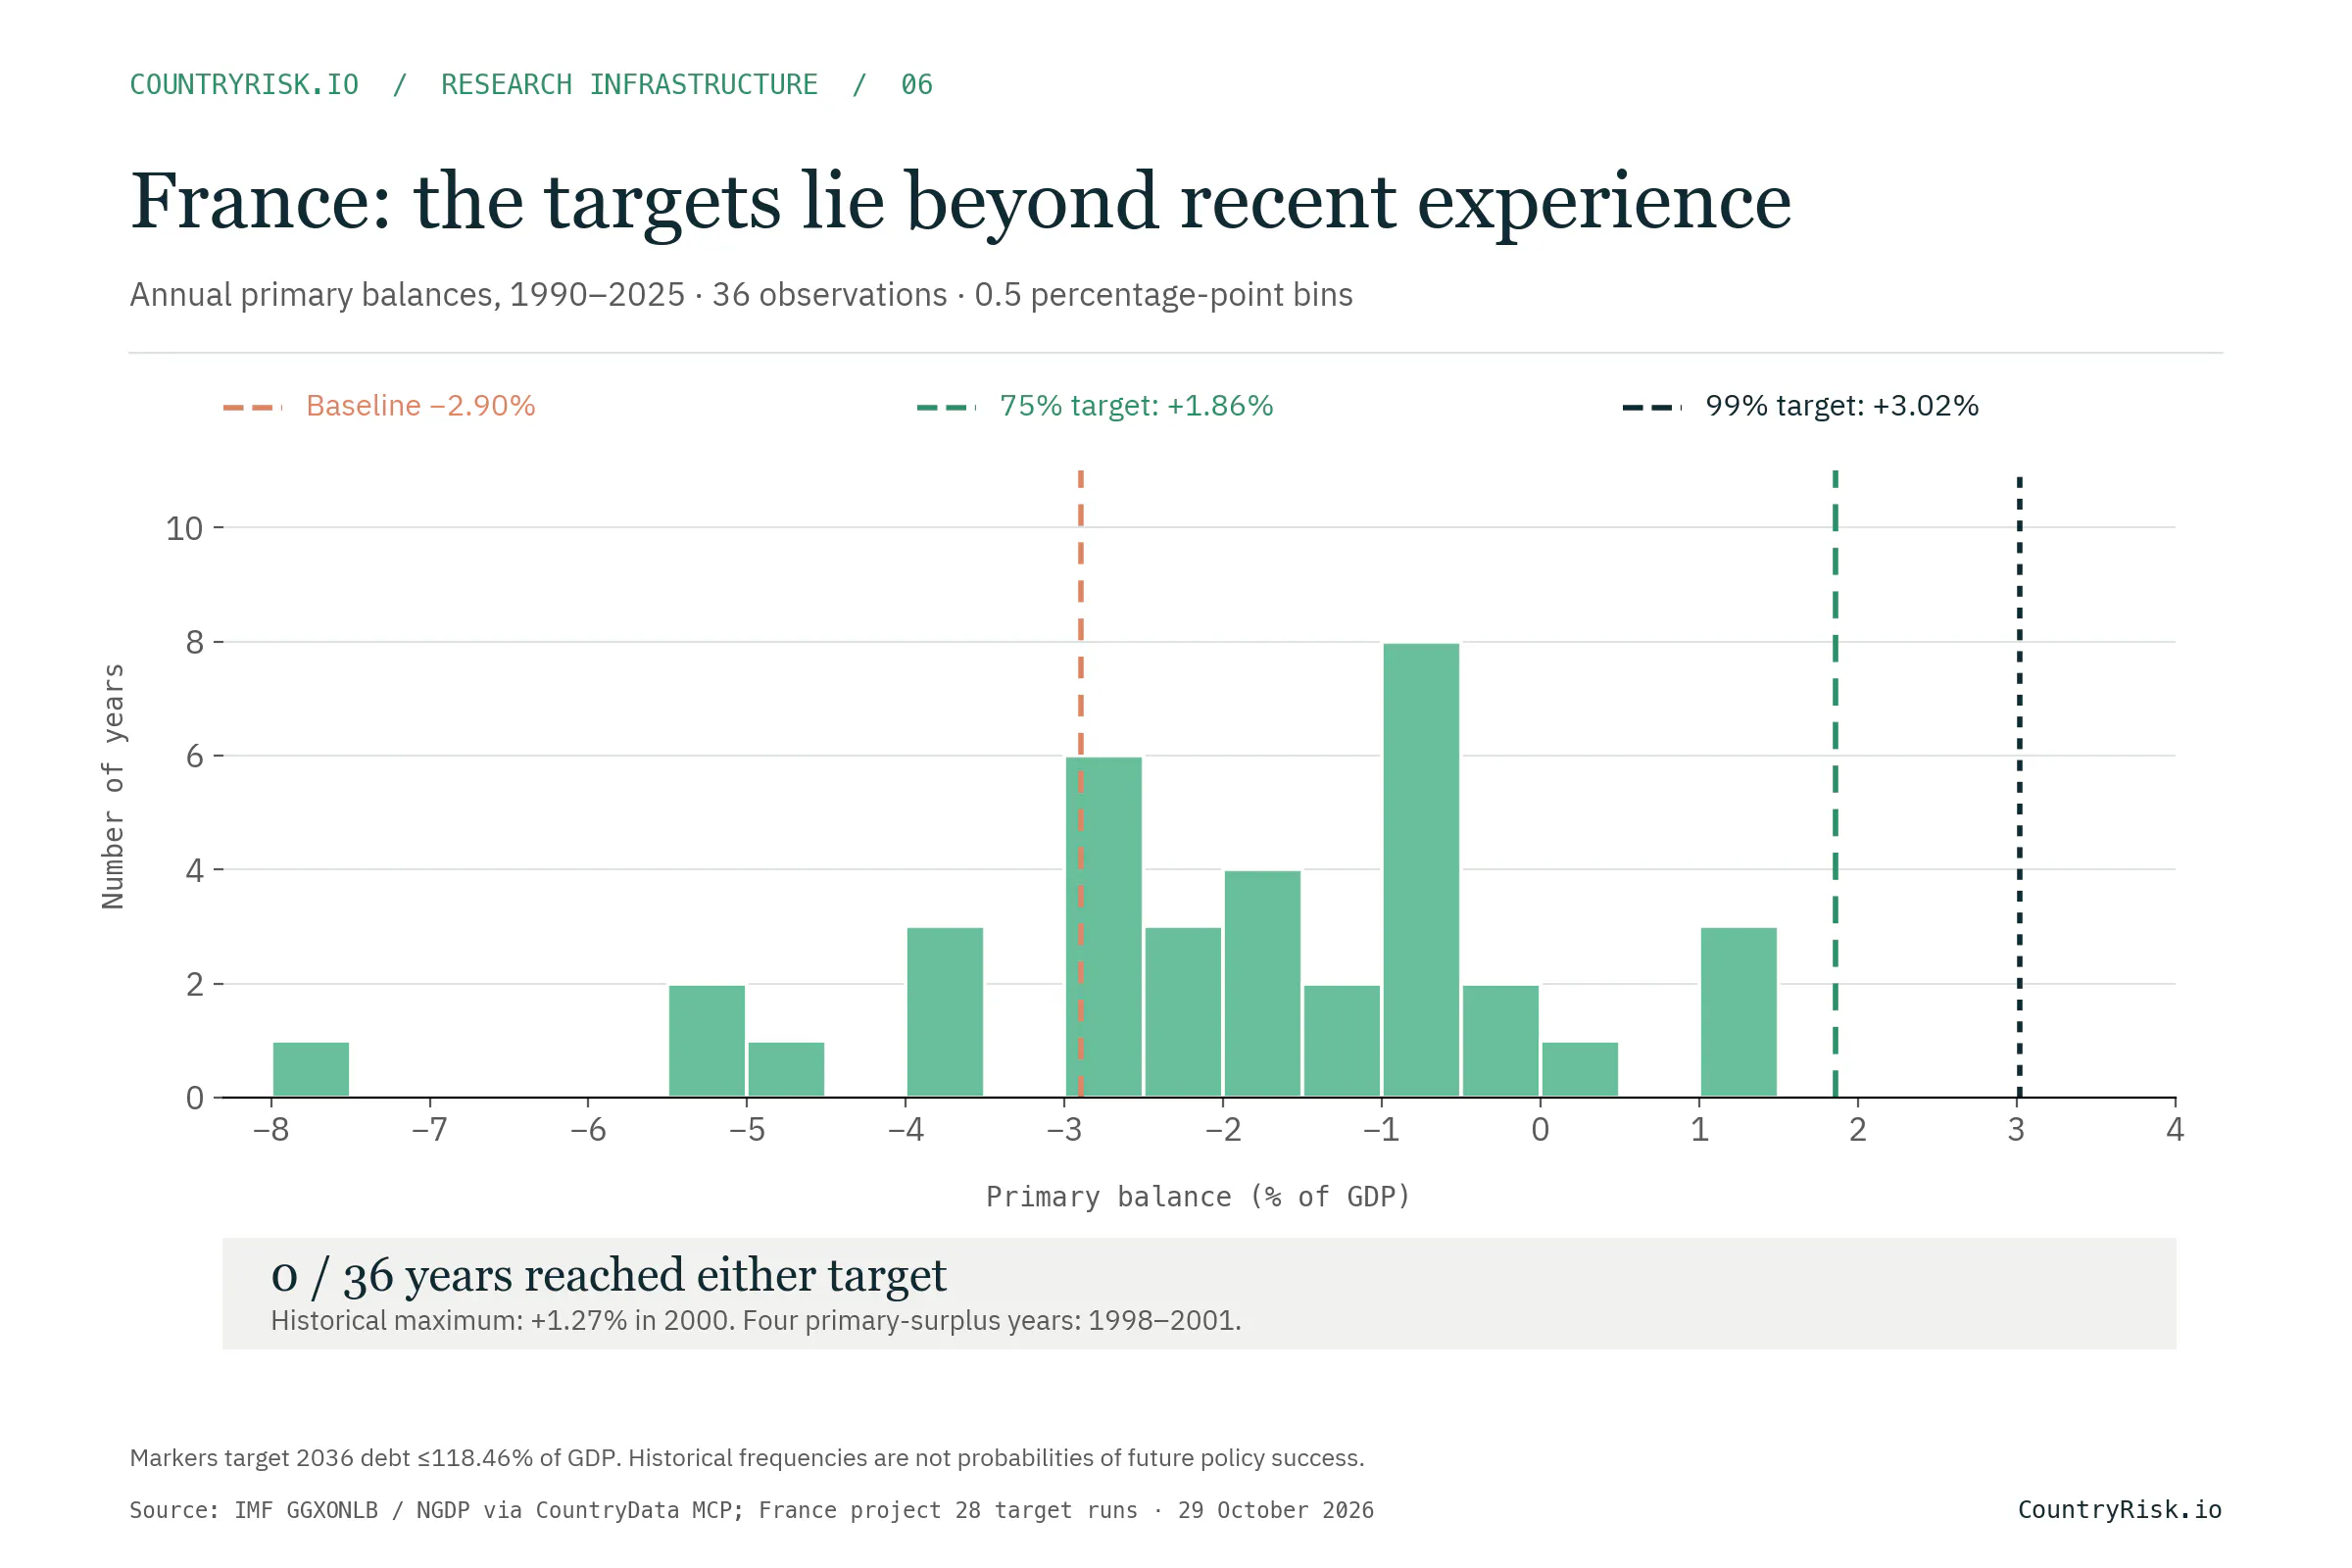
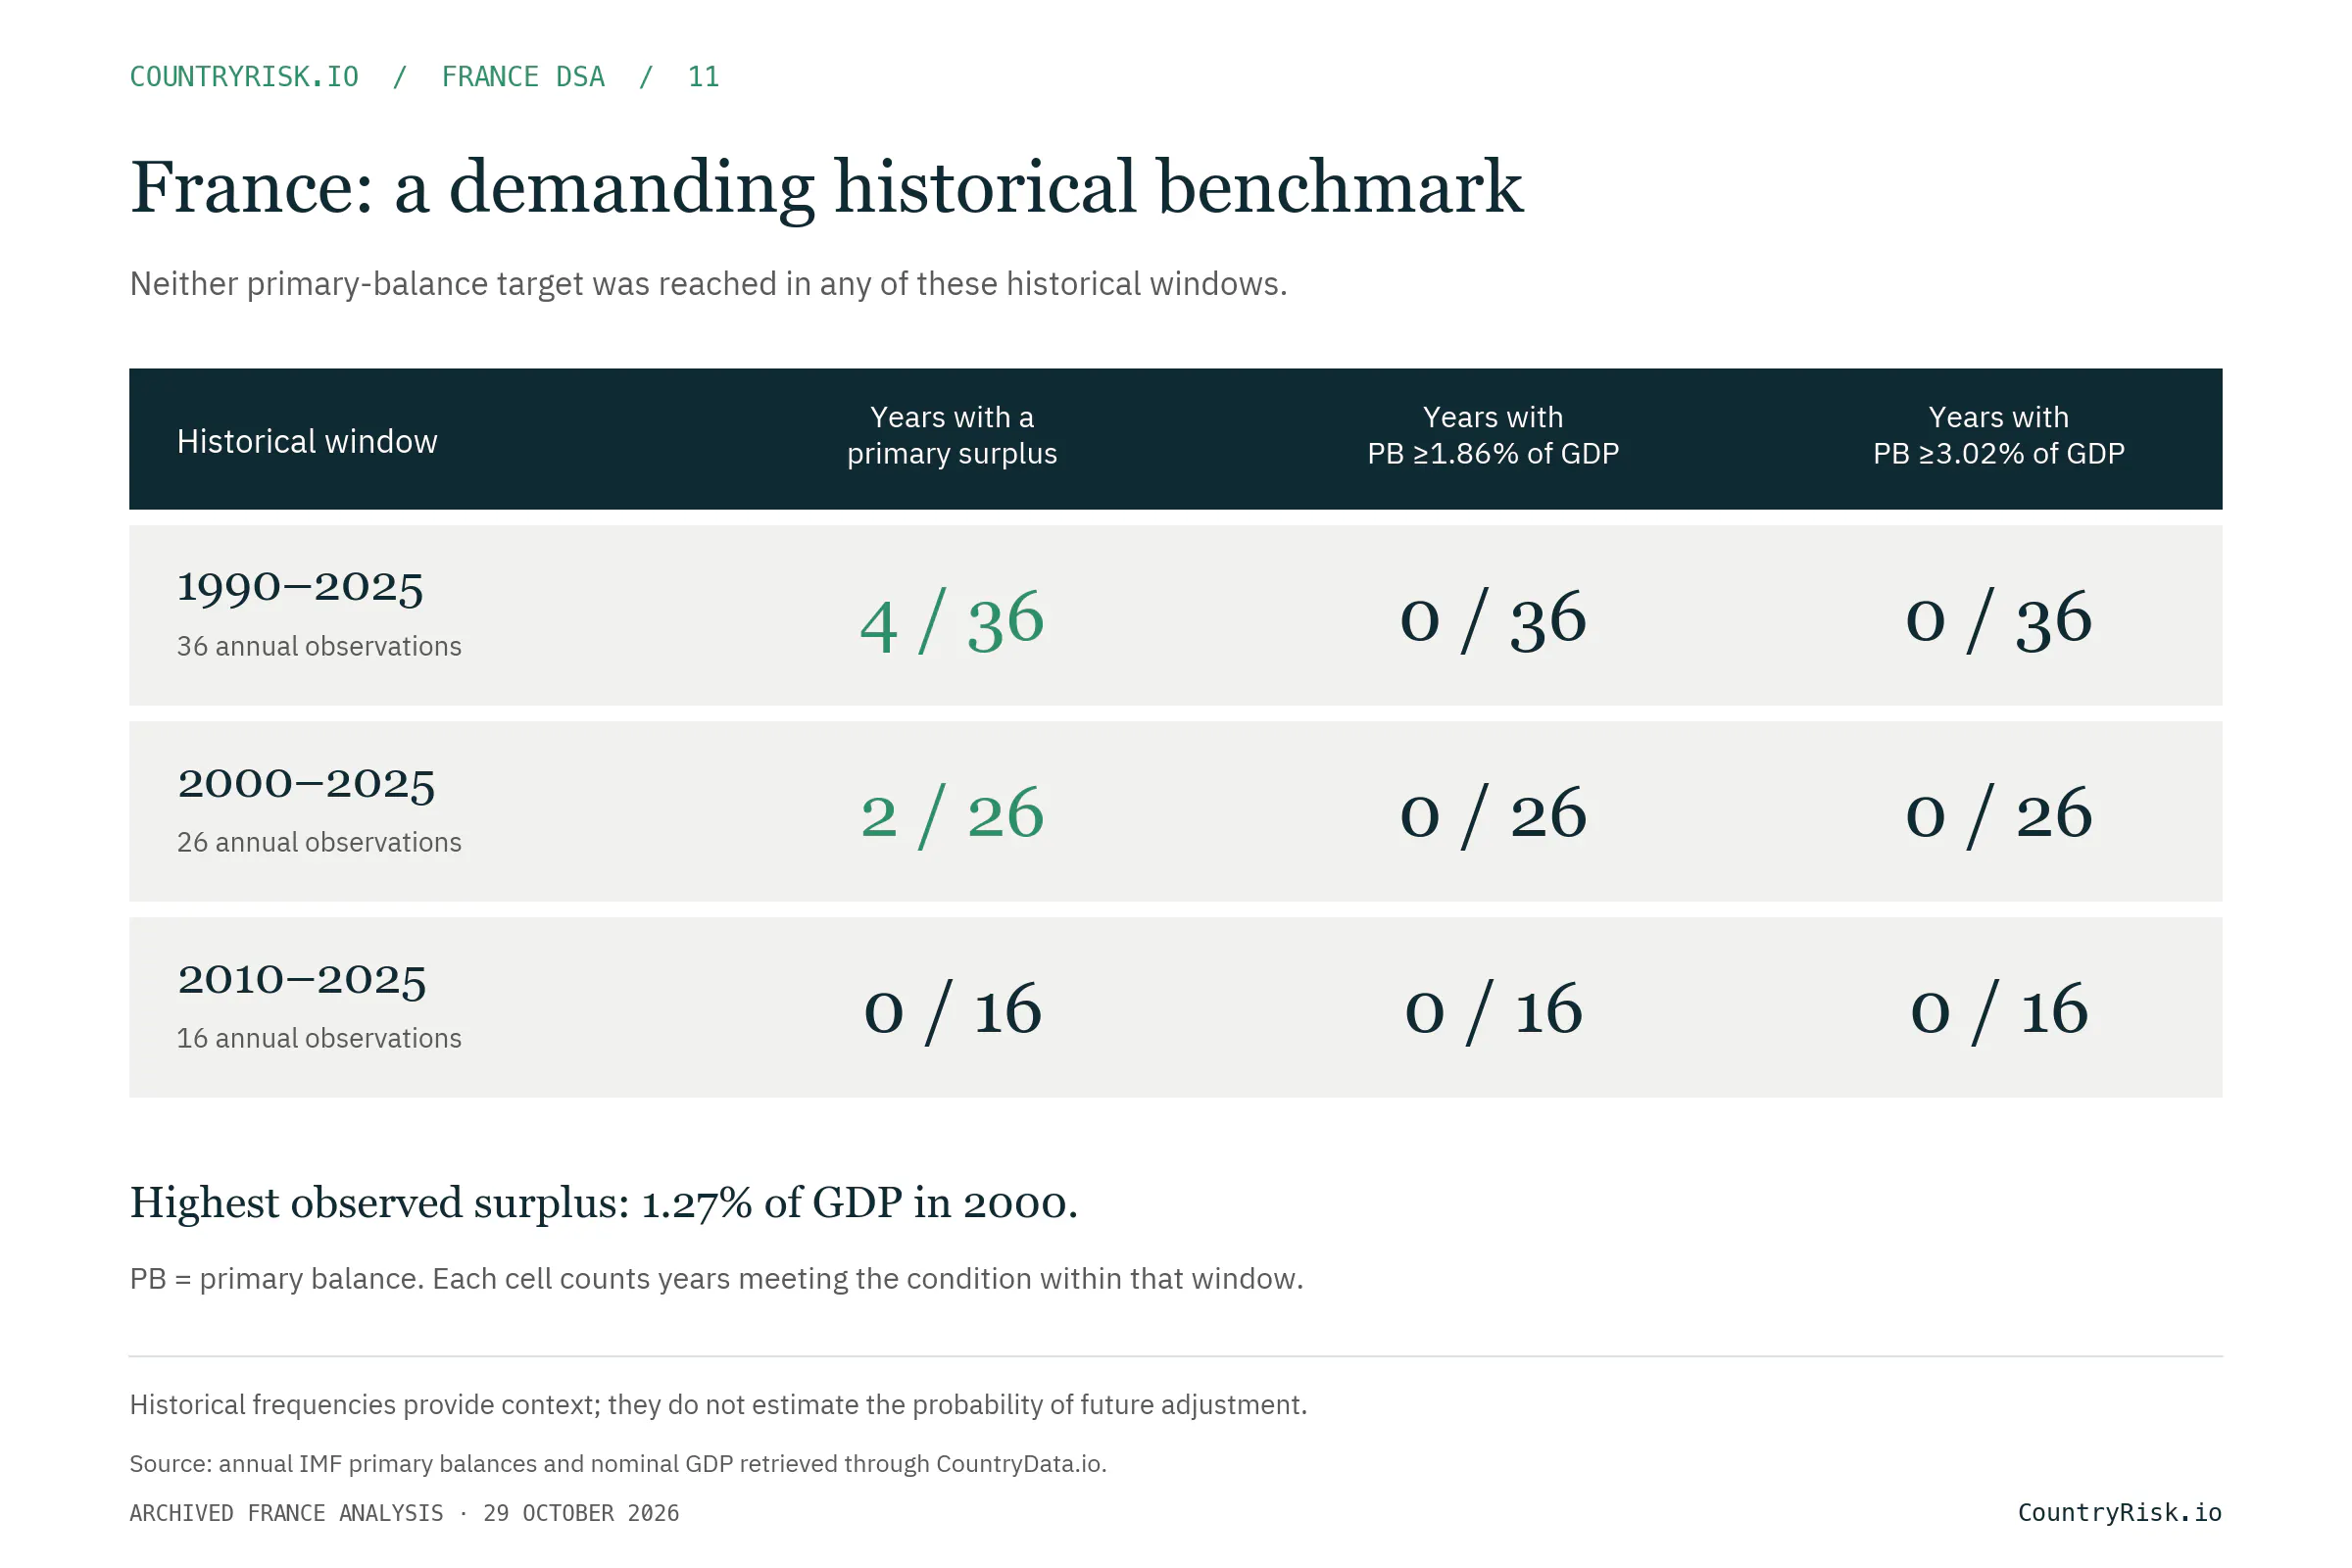
A historical histogram gives these model targets a useful reality check. Using annual IMF primary balances and nominal GDP retrieved through CountryData.io, France recorded a primary surplus in only four of the 36 years from 1990 to 2025: 1998–2001. Its highest surplus was 1.27% of GDP in 2000. Neither the 1.86% nor the 3.02% target was reached in any year in that sample.
This does not make the targets impossible, nor does a historical frequency of zero imply a zero probability of future adjustment. It shows the extent of the departure from France’s recent fiscal record. The modeled policy would also have to sustain the target after reaching it in 2031, rather than achieve it for a single year. The histogram adds context for assessing that requirement; it is not an estimate of policy credibility.
What does the adjustment mean in euros?
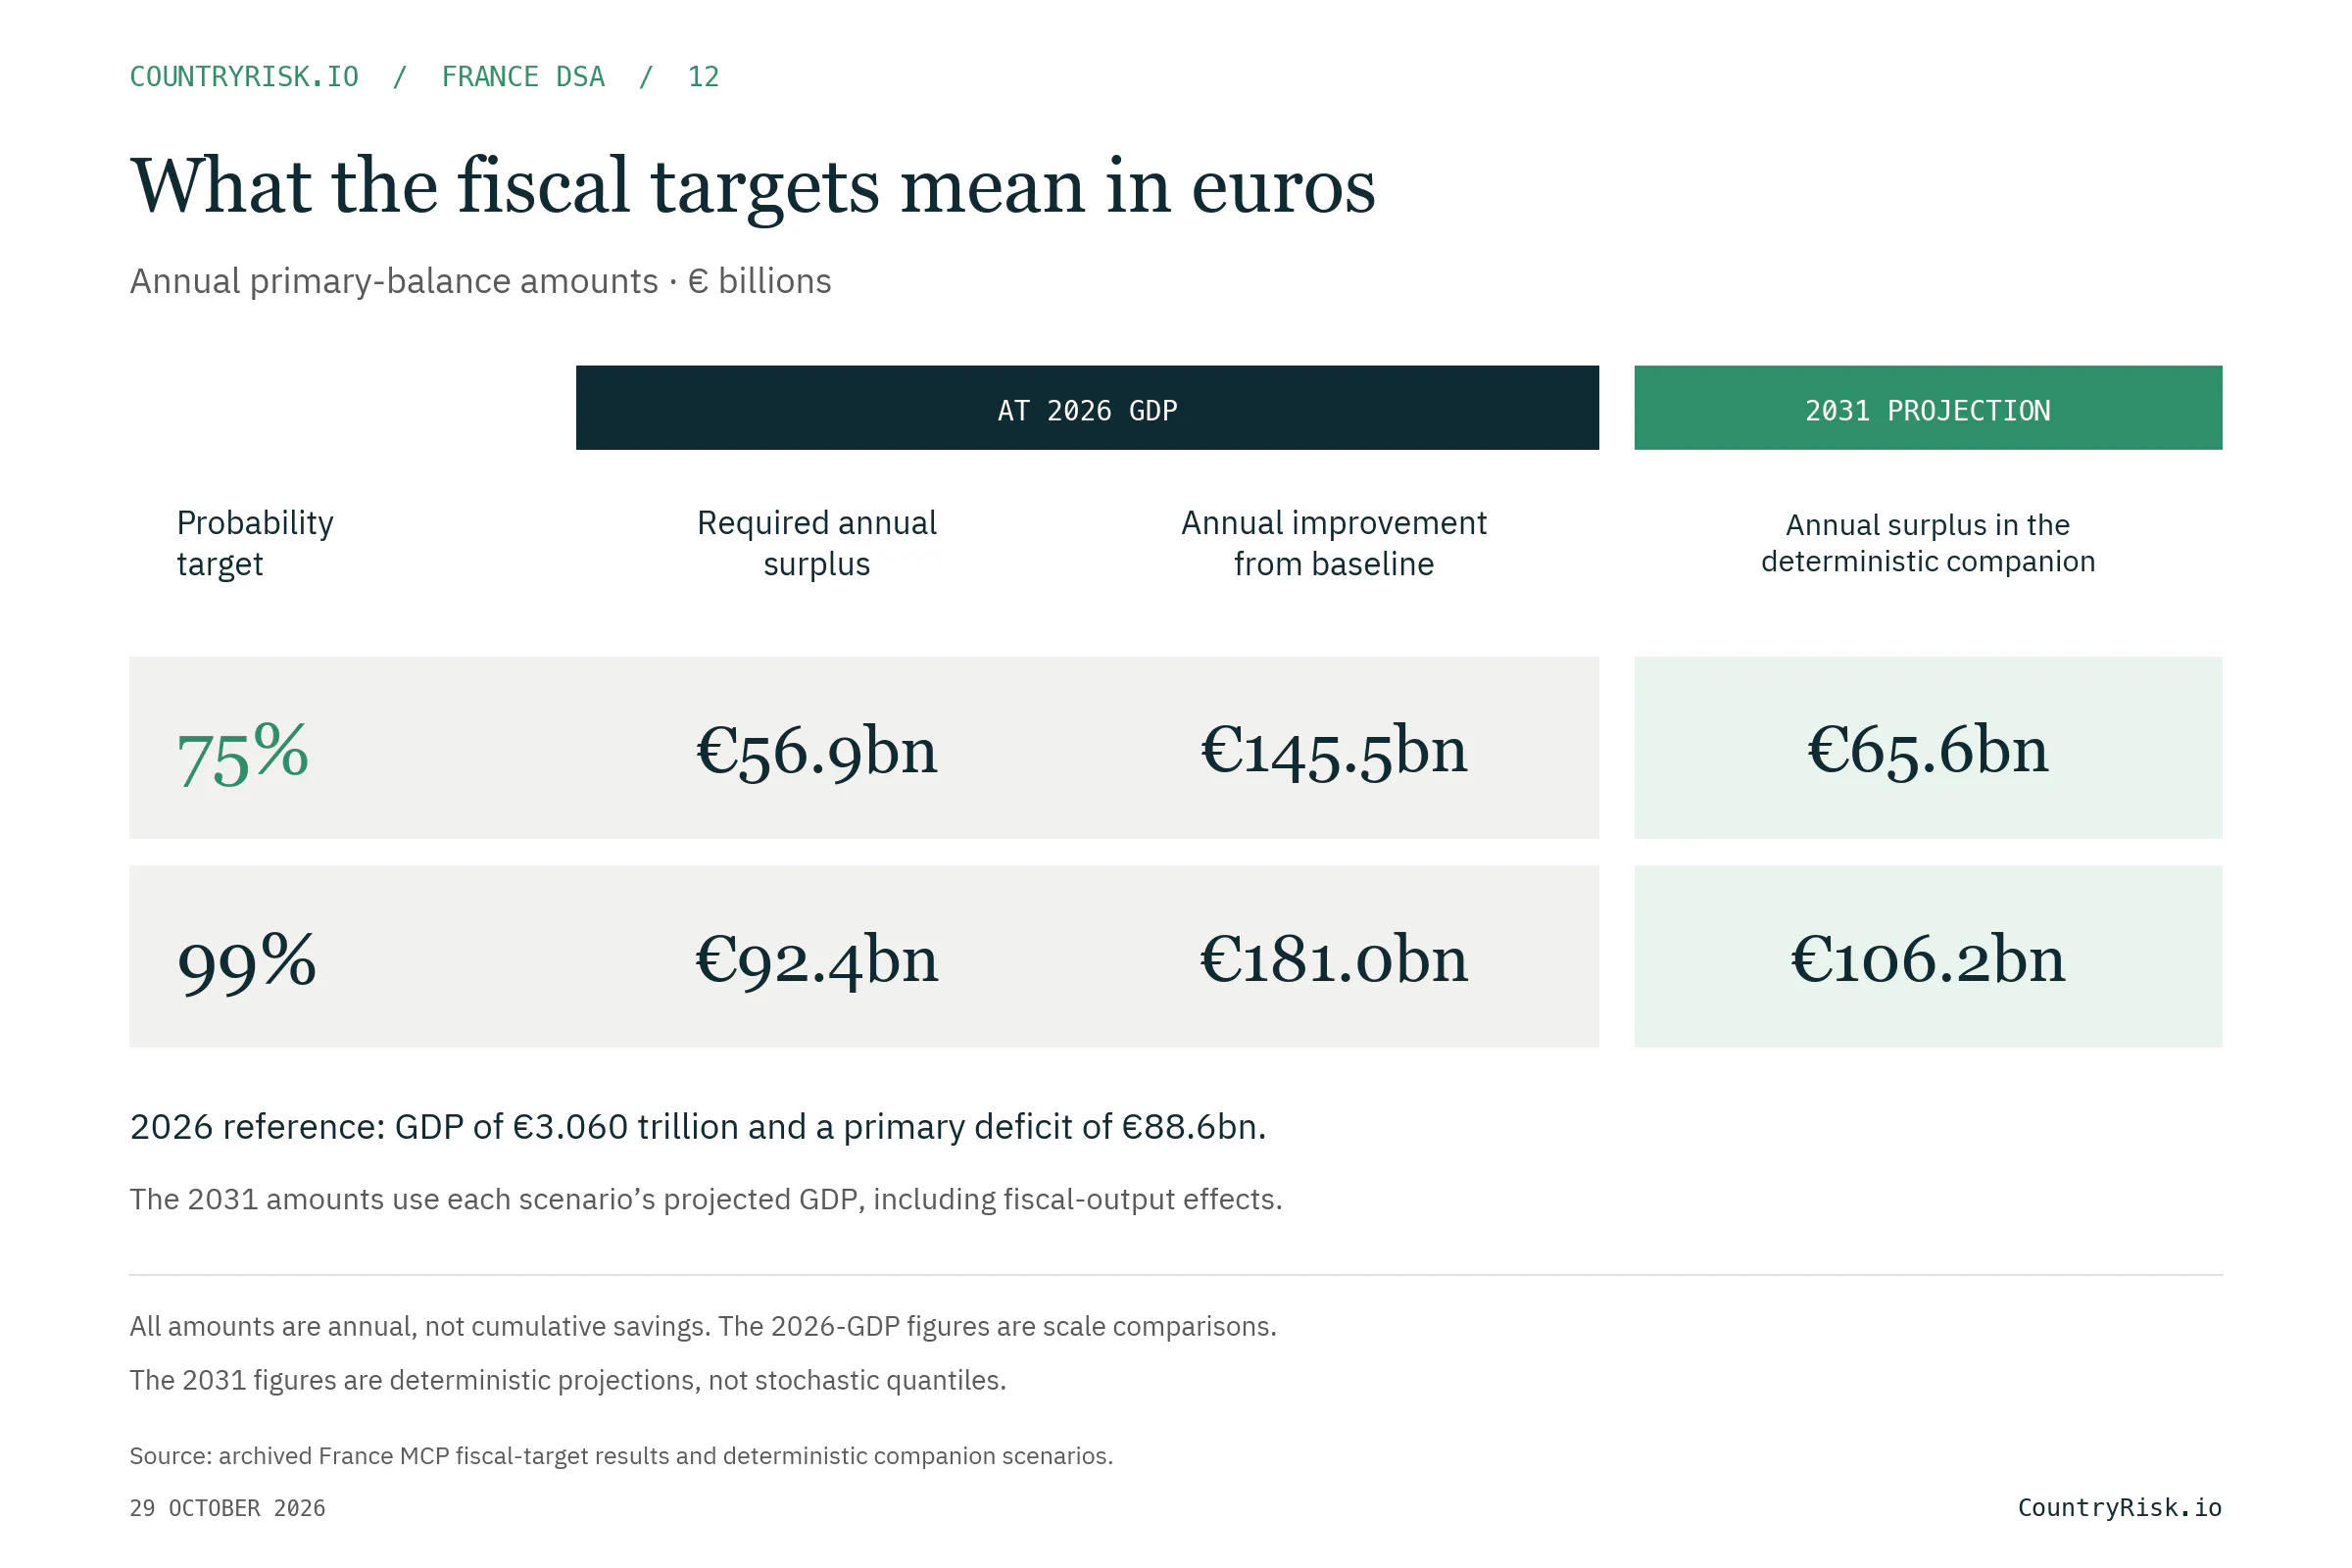
The DSA uses €3.060 trillion of nominal GDP in 2026. Holding that denominator fixed makes the scale transparent: one percentage point of GDP is approximately €30.6bn. The baseline primary deficit of −2.90% corresponds to €88.6bn a year.
The first two columns translate the ratios into euros at the size of the 2026 economy; they are neither cumulative five-year savings nor forecasts of 2031 amounts. The last column uses each scenario’s own 2031 nominal GDP from its deterministic companion, including the model’s fiscal-output effects. These euro amounts are not stochastic quantiles. The adjustment concerns the general-government primary balance—revenues minus expenditure excluding interest—and could combine revenue measures, expenditure changes and changes in the economic base.
Putting the figures alongside the latest budget
As of 29 October 2026, the latest budget proposal is the 2027 draft finance bill, still under parliamentary examination. As introduced on 1 October, it specifies €511bn within the State expenditure perimeter (PDE), which excludes debt interest, and a 5.0% of GDP general-government overall-deficit target. The latter includes interest and should not be confused with the primary balance used above. These are proposal figures, not enacted spending or the complete general-government expenditure total. Draft finance bill; parliamentary status.
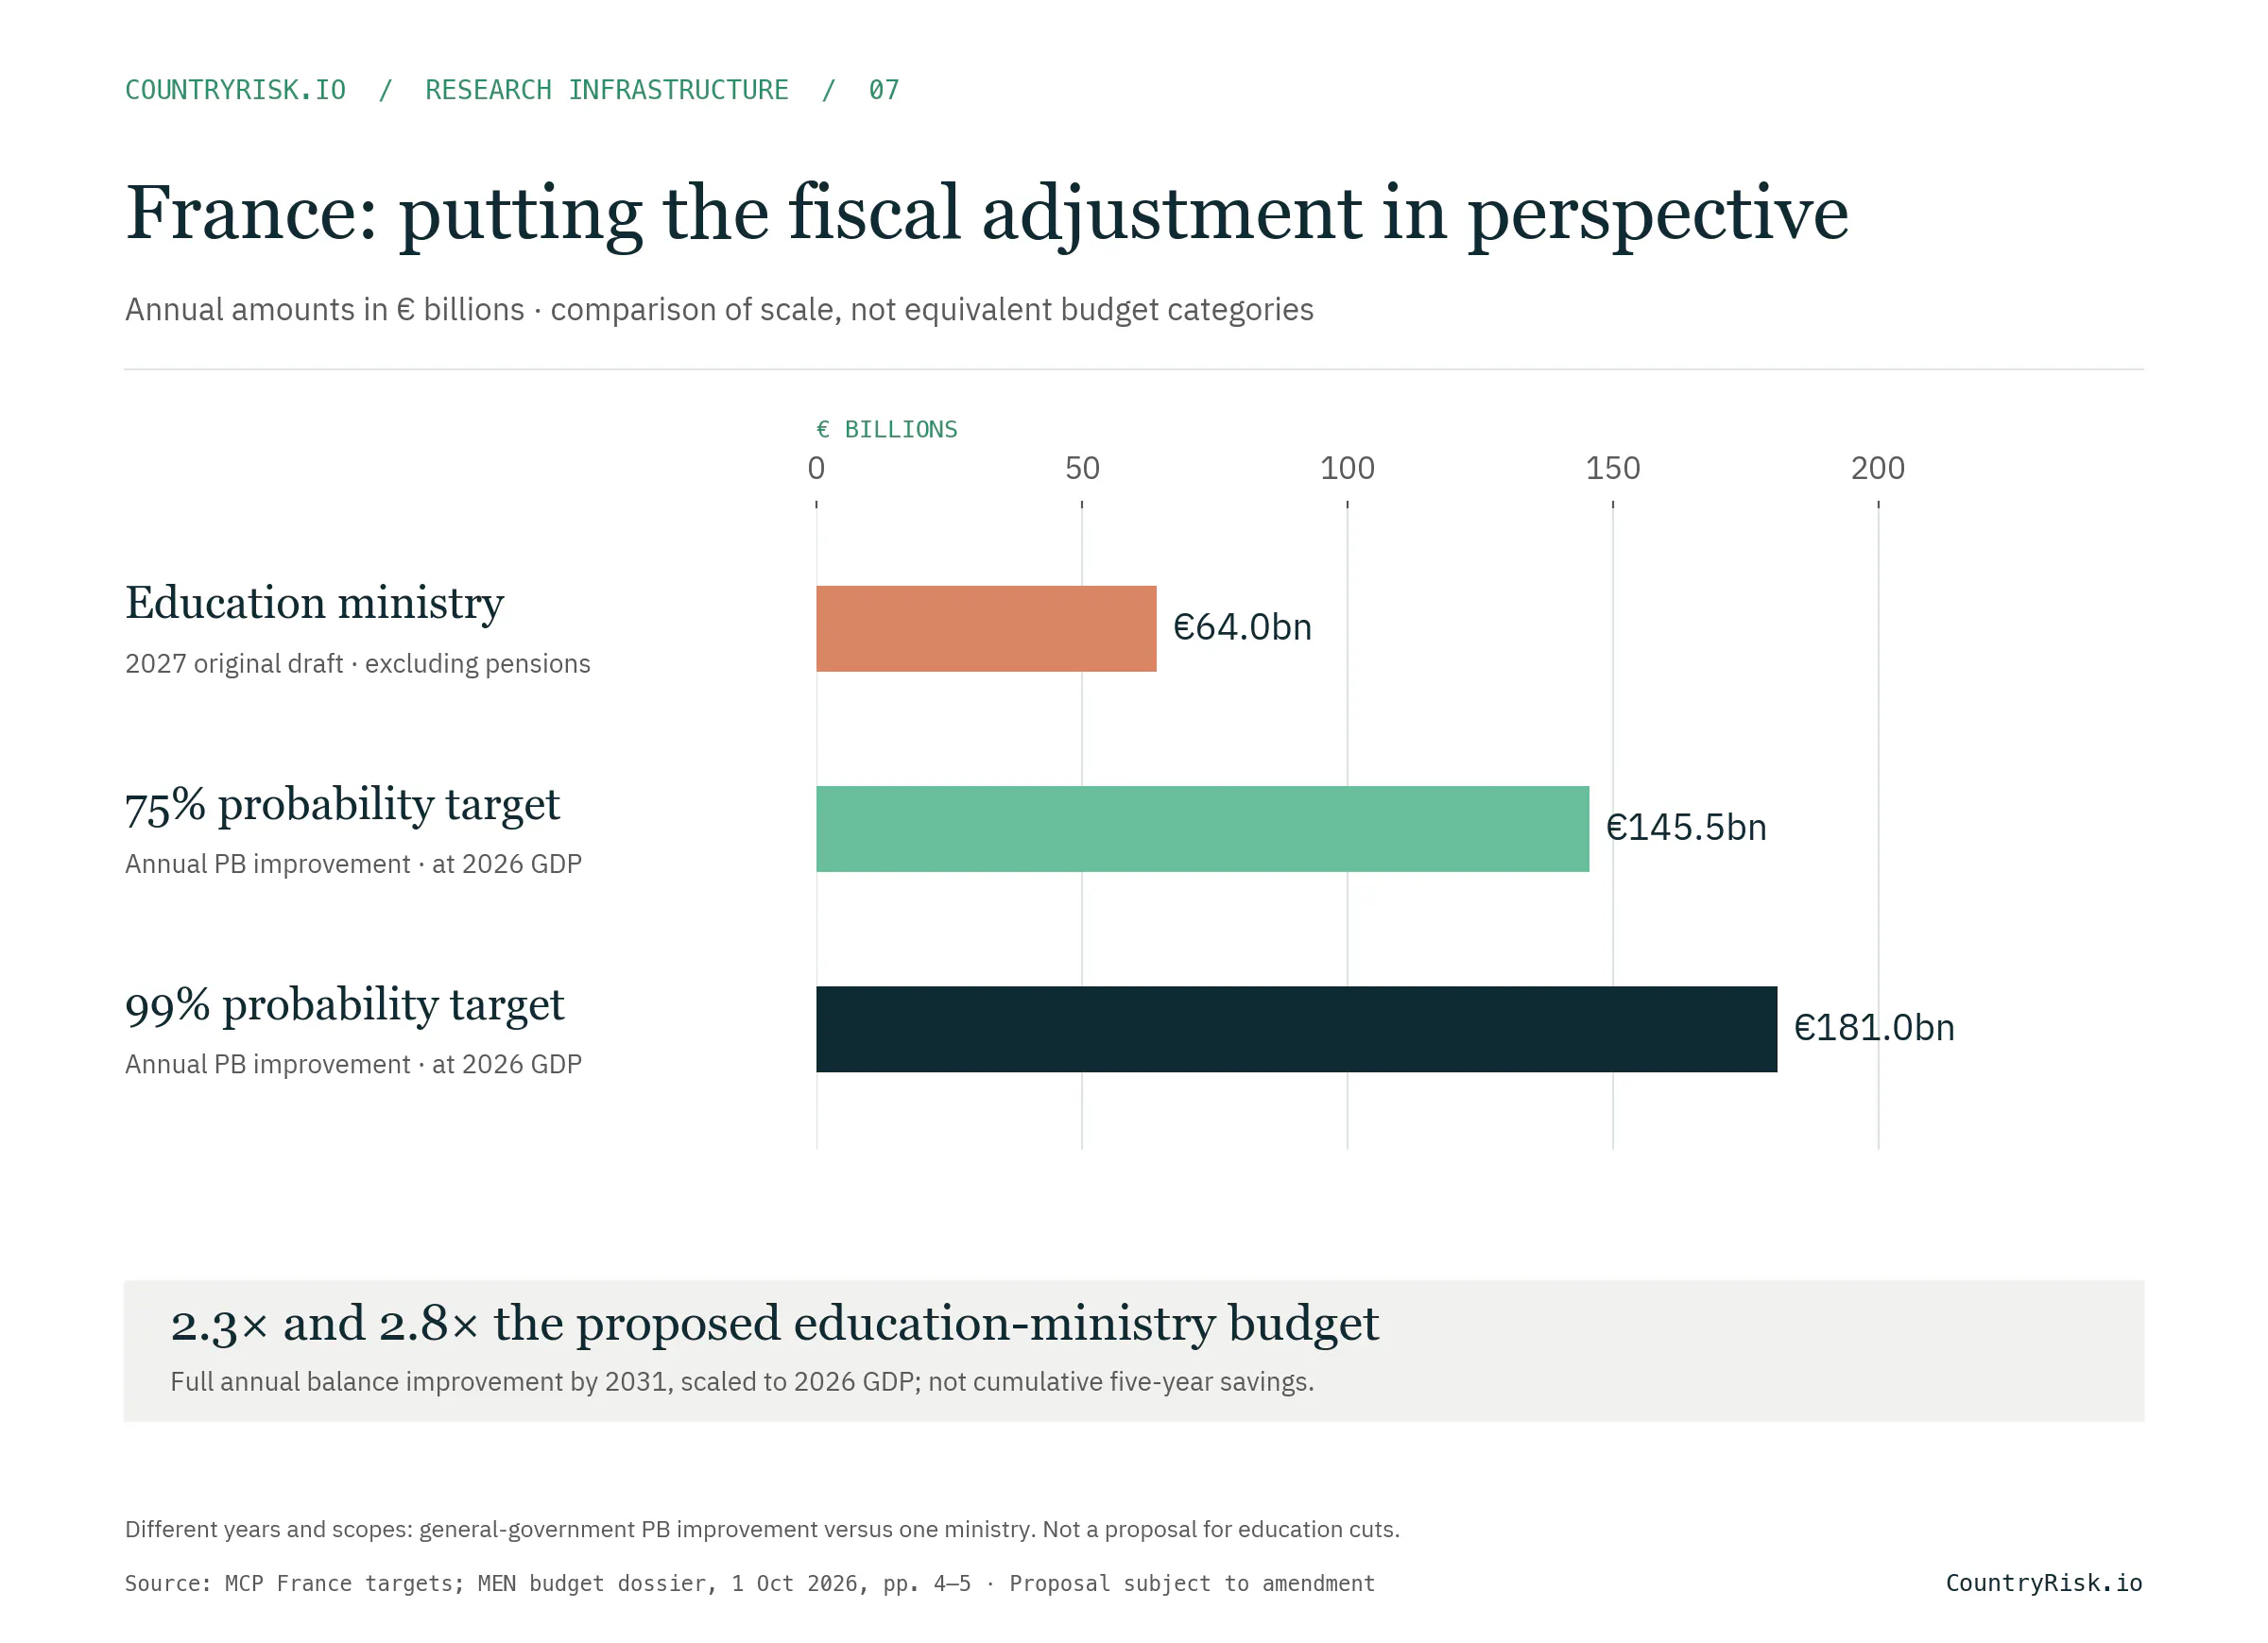
For education, the ministry’s original 2027 presentation provides €64.0bn excluding State pension contributions, or €89.1bn including them. The annual balance improvements of €145.5bn and €181.0bn, expressed at 2026 GDP, are approximately 2.3 and 2.8 times that €64bn ministry allocation. This is a comparison of scale across different years and institutional perimeters, not a like-for-like budget reconciliation or a proposal to cut education. The government announced further education measures on 26 October, so the original allocation remains a dated benchmark subject to amendment. Education ministry budget dossier, pp. 4–5; 26 October announcements.
The ministry budget is also narrower than total education spending. The latest DEPP release reports €199.2bn spent on education in 2025, equivalent to 6.7% of GDP, covering State and local government, other public bodies, households and businesses. It is therefore not a single public-budget envelope. DEPP, published 29 September 2026.
This is another practical benefit of the workflow: a model target can be checked against historical fiscal outcomes, translated into euros and placed alongside current budget documents. CountryData.io supplies the analytical data and calculation engine; CountryRisk.io Insights platform provides the AI assistant interface and a wide range of capabilities such as skills library, web research, report generation with a given corporate branding.
Sovereign analytics as working infrastructure
NatureFinance’s recent discussion of SovTech makes a compelling case for capturing repeatable analytical work in software so that smaller teams can examine more scenarios. Its work with Teal Insights focuses on an early LIC-DSF scenario tool and the needs of finance ministries.
That direction is welcome. For CountryRisk.io, the combination of connected data, programmable debt analysis and AI-assisted execution is already a working workflow: we have used it to run analyses across the EU and answer subsequent country-specific questions through the same interface.
The applications and methodologies differ. Our toolkit is not an official IMF–World Bank LIC-DSF implementation, and the EU exercise does not demonstrate equivalence to one. It does demonstrate that the infrastructure for repeatable sovereign analysis can already be put to practical use.
CountryRisk.io supplies the analytical engine. CountryData.io connects it to the data. MCP makes both available to an assistant that can coordinate the work, preserve the evidence and help the analyst explore the next question.
The result is more time to examine assumptions, financing risks and policy credibility—and less repeated effort getting the analysis into a usable form.