Explaining OECD Country Risk Classifications with Macro and Governance Data
The OECD country risk classifications play a critical role in global trade and cross-border financing because they directly influence the cost and availability of export credit insurance and official export financing. Higher-risk classifications generally translate into higher insurance premia and financing costs for exporters, affecting the pricing and competitiveness of international trade transactions. As a result, the classifications matter not only for exporters and banks, but also for the destination countries themselves. A weaker country risk classification can reduce a country's attractiveness as a trade and investment destination by increasing the perceived cost and risk of doing business in or with that country. In this sense, OECD country risk classifications have broader economic implications, influencing trade flows, investment decisions, and external financing conditions.
Under the OECD Arrangement on Officially Supported Export Credits, countries are assigned country risk classifications on a scale from 0 to 7, where 0 represents the lowest level of country risk and 7 the highest. However, classes 0 and 1 are somewhat special. Class 0 was used in the past for high-income countries but is not used anylonger; with the only exception being Singapore that is assigned Class 0. Similarly, there is currently no country classified into the Class 1. If a reader has any insights, we would love to hear from you. The OECD definition of country risk includes transfer & convertibility risk and cases of force majeure (https://www.oecd.org/en/topics/sub-issues/country-risk-classification.html). The classifications are determined through a combination of quantitative and qualitative assessments conducted by the Participants to the OECD Arrangement and their export credit agencies. Publicly available OECD documentation suggests that the framework incorporates payment experience, external debt sustainability, foreign exchange liquidity, macroeconomic stability, fiscal and current account performance, institutional quality, and broader political and structural risks. The process is supported by the OECD Country Risk Assessment Model (CRAM), which uses macroeconomic and financial indicators from sources such as the IMF and World Bank, while qualitative expert judgment and country-specific assessments by export credit agencies also play an important role in the final classification outcome.
What is publicly known about the review process is relatively limited. The OECD indicates that classifications are reviewed regularly by the Country Risk Experts' Group, with reviews triggered both by periodic monitoring and by significant changes in a country's economic, financial, or political situation. Countries may therefore be reclassified following major macroeconomic deterioration or improvement, debt distress events, payment difficulties, geopolitical developments, or shifts in institutional stability. The review process combines the quantitative signals from CRAM with expert judgment from participating export credit agencies. However, the detailed discussions, calibration choices, voting dynamics, and country-specific rationales behind individual classification decisions are not publicly disclosed.
This lack of transparency creates an interesting analytical challenge for researchers and market participants. While the OECD publishes the final classifications and broad methodological principles, the exact model specification, variable weightings, and decision-making process behind the ratings remain only partially observable from the outside. Yet the classifications have significant implications for financing costs, trade competitiveness, and investment attractiveness. Building a macroeconomic model that explains and approximates OECD country risk classifications therefore becomes valuable both as a research exercise and as a practical tool for exporters, investors, and policymakers seeking to better understand the determinants of trade-related country risk.
This project builds a transparent benchmark model around that problem. The aim is not to replicate the confidential OECD process or replace the judgment of the Participants. The aim is narrower: given observable macroeconomic, governance, market, sovereign- and country-risk, and payment-stress indicators, where would a country's OECD class likely sit, and where does the published classification look materially stricter or more lenient than the model-implied value?
Why an Ordinal Model?
OECD country risk classes are ordered categories. A class 6 is riskier than a class 5, and a class 5 is riskier than a class 4. But the distance between classes is not guaranteed to be numerically identical. Moving from class 1 to class 2 may not represent the same change in risk as moving from class 6 to class 7.
For that reason, the main specification uses an ordered-logit model rather than a linear regression. The model estimates the probability that each country-year belongs in each OECD class from 0 to 7. From those probabilities, it produces two useful outputs:
- the predicted class, which is the single most likely OECD class;
- the expected rating, which is the probability-weighted average class.
The expected rating is often the more informative diagnostic. A country with an expected rating of 4.8 is much closer to class 5 than to class 4, even if the single most likely discrete class is still 5.
Data and Features
The model estimates on 4,460 country-year observations from 174 countries between 1999 and 2025 and scores 4,628 country-year observations. The target is the annual OECD classification, constructed from dated classification snapshots by taking the last available classification in each year. We retained the Class 0 for high income countries despite the class being removed as mentioned before.
The explanatory variables are designed to mirror, as far as public data allows, the broad risk blocks described in the OECD framework. Domestic variables are lagged by one year to reduce look-ahead bias. The model includes CountryRisk.io's sovereign risk score, GDP growth, inflation, current account balance, reserves coverage, government debt, fiscal balance, external debt, GDP per capita, and a banking-sector non-performing-loan proxy for payment stress. It also includes the World Bank Worldwide Governance Indicators, covering control of corruption, rule of law, political stability, government effectiveness, regulatory quality, and voice and accountability. Global conditions enter through annual averages for market volatility, US interest rates, and oil prices.
The payment-experience proxy deserves a caveat. OECD payment experience is closer to the repayment behavior observed by export credit agencies, including obligor-level and claims experience. That information is not publicly observable in the same way as macroeconomic data. As a practical approximation, the model uses bank non-performing loans as a share of gross loans. This is not the same concept, but it captures domestic credit repayment stress better than a pure sovereign default indicator would.
As the OECD definition explicitly refers to capital controls, we also tested whether the IMF Financial Account Restrictiveness Index would add some value to the model. So unconditionally, higher FARI is associated with higher OECD risk. However, when included in the model the coefficient becomes negative. That is therefore likely a conditional effect after controlling for sovereign risk score, macro variables, governance, debt, reserves, etc. As the added explanatory power of the FARI was very limited, we did not include it in the final model specification.
Model Performance
The model is best understood as a one-notch classification benchmark, not as an exact reconstruction of the OECD process.
On the full scored sample, the model gets the exact OECD class right in 59.8% of observations and lands within one notch in 83.9% of observations. The mean absolute notch error is 0.63, while the mean absolute expected-rating error is 0.67. Excluding class 0 from the evaluation sample, exact accuracy is 52.9% and within-one-notch accuracy is 82.8%.
That is a useful result, but it should not be over-interpreted. OECD classifications are sticky, expert-reviewed, and partly qualitative. A transparent macro model should capture the broad ordering of country risk, but it should not be expected to match every country-specific notch decision.
What Drives the Model?
The model's strongest relationships are intuitive. Higher CountryRisk.io sovereign risk scores, higher external debt, higher inflation, and higher banking-sector non-performing loans are associated with higher OECD risk classes. Stronger reserves coverage, higher GDP per capita, and stronger governance indicators are associated with lower OECD risk classes. Among the governance variables, regulatory quality, government effectiveness, and voice and accountability all point in the expected direction, although individual governance coefficients should be interpreted cautiously because these indicators overlap conceptually with each other and with broader sovereign-risk scores.
The payment-stress proxy also enters with the expected positive sign: countries with more visible banking-sector repayment stress tend to receive higher-risk OECD classifications, all else equal. Still, this should be read as a proxy rather than as a direct measurement of OECD payment experience. The latter is likely to include confidential export-credit-agency information about arrears, recoveries, claims, reschedulings, and obligor-level performance.
Reading the Country Charts
The country charts compare the actual OECD class with the model's expected rating and predicted class. The actual OECD classification is shown as a step line because OECD classes are discrete and change only when the published classification changes. The expected rating moves more smoothly because it is derived from the full probability distribution across classes.
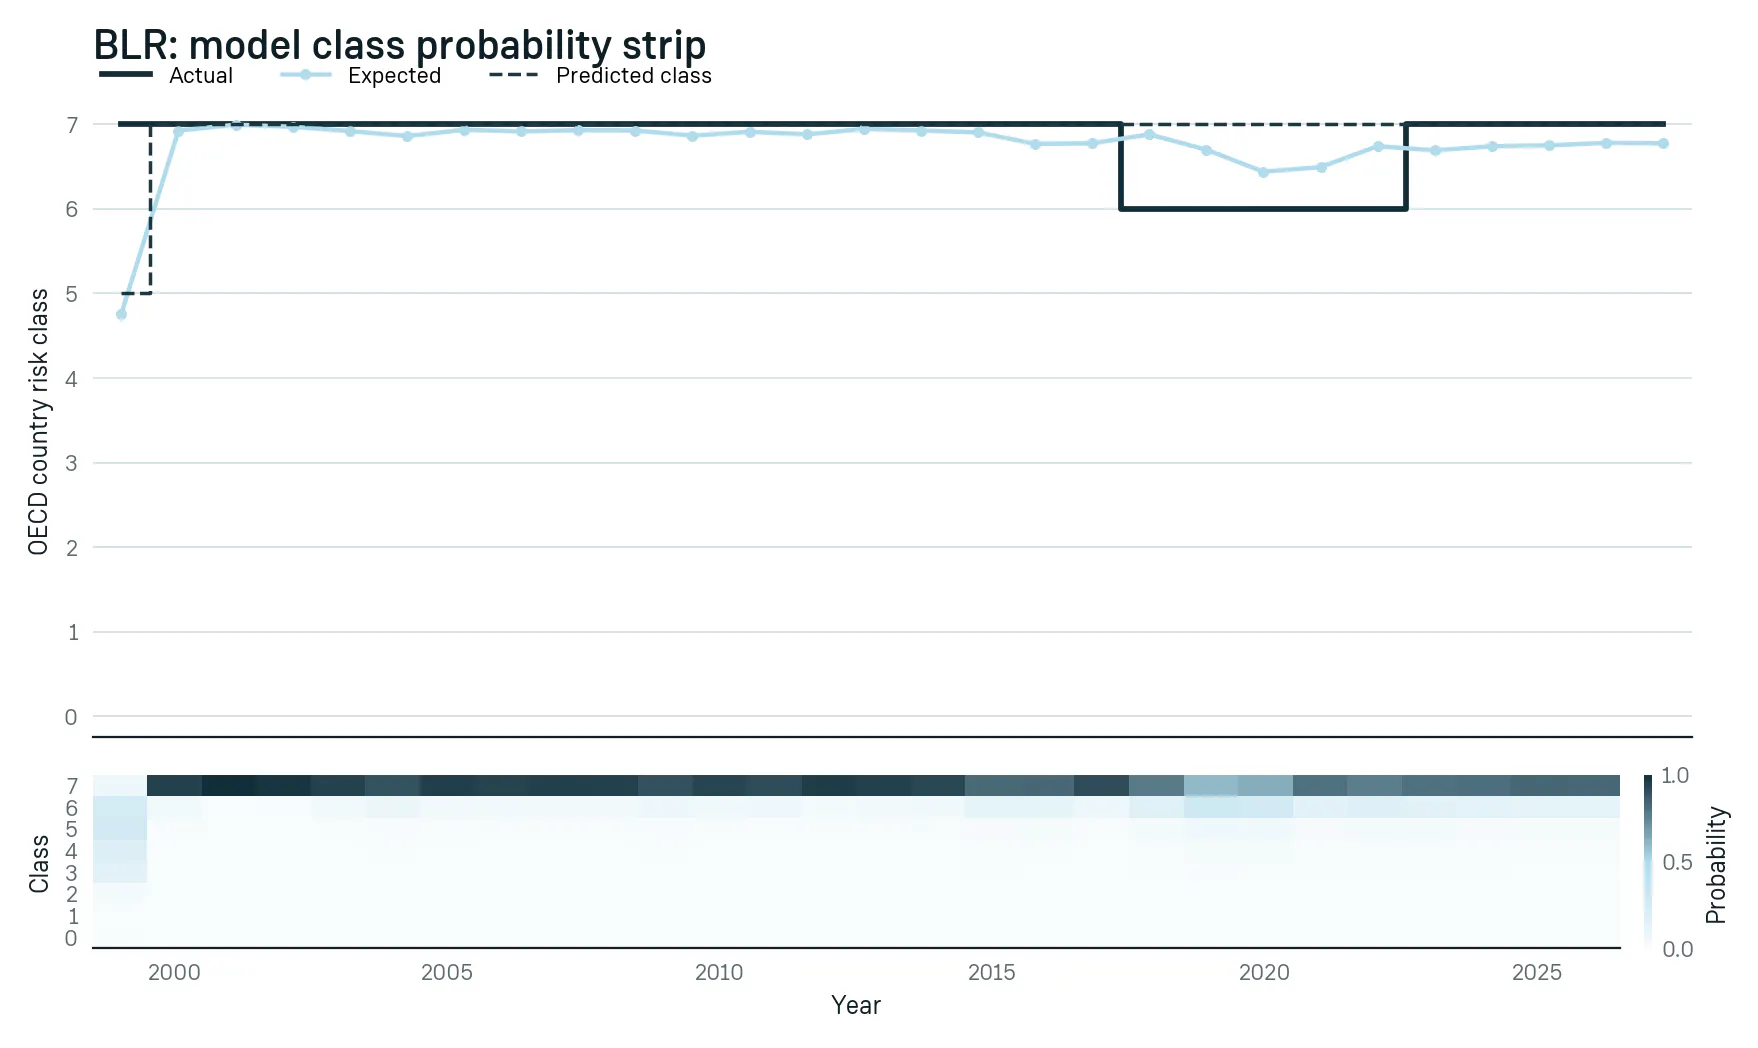
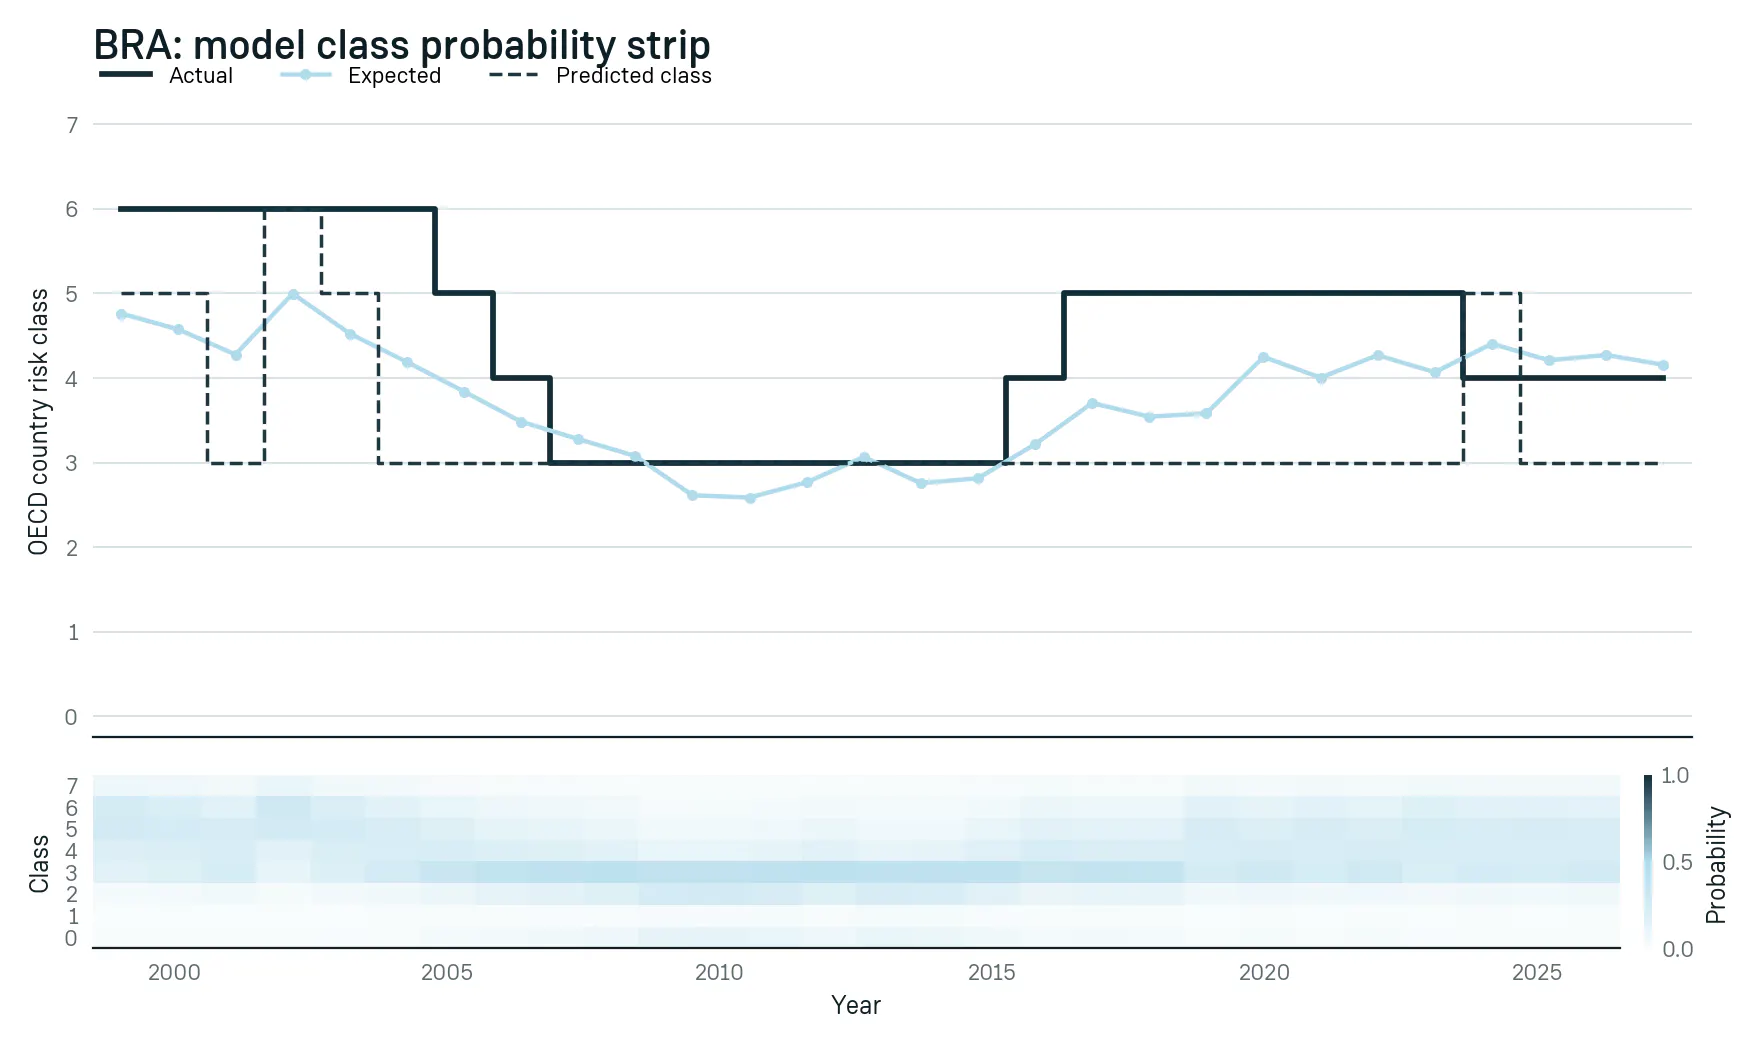
The probability-strip charts add a lower panel that shows the full model-implied probability distribution across OECD classes 0-7 for each year. Darker cells indicate classes to which the model assigns more probability. A narrow, dark band concentrated on one row means the model is confident about the class. A lighter or vertically wider pattern means the probability mass is spread across several neighboring classes, so the model is less certain even if the expected rating line looks stable.
Below are a few illustrative examples, and feel free to reach out if you would like to receive the full dataset and chart pack. The first chart focuses on Belarus. Historically, the OECD classified the country in the highest risk category for most of the sample period. There was only a brief improvement to Class 6 in 2018 before the country returned to Class 7 in early 2022. The macroeconomic fundamentals in our model also pointed to some improvement during that period, although Class 7 remained the most likely classification based on the model output.
The second chart focuses on Brazil and illustrates the value of the probability strip plot shown in the lower panel. In contrast to Belarus — where the probability mass was heavily concentrated in the highest risk category — the model uncertainty for Brazil is significantly higher, with probabilities distributed across several neighboring classes. Brazil’s current OECD classification is Class 4 and sits very close to the model’s expected rating, which is the probability-weighted average across all classes. However, the single most likely class at present is actually Class 3. Looking back over time also shows that the predicted class metric can be relatively volatile, as small probability shifts may change the most likely discrete class. For that reason, we generally view the expected rating as the more informative and stable metric.
The high-frequency OECD charts are diagnostic overlays rather than a higher-frequency model. The model remains annual, while the charts show dated OECD rating snapshots against the annual model expected rating and predicted class.
You can view the model output and OECD country risk classifications on our CountryRisk.io Insights platform. Head over here and create a free trial account (https://www.countryrisk.io).
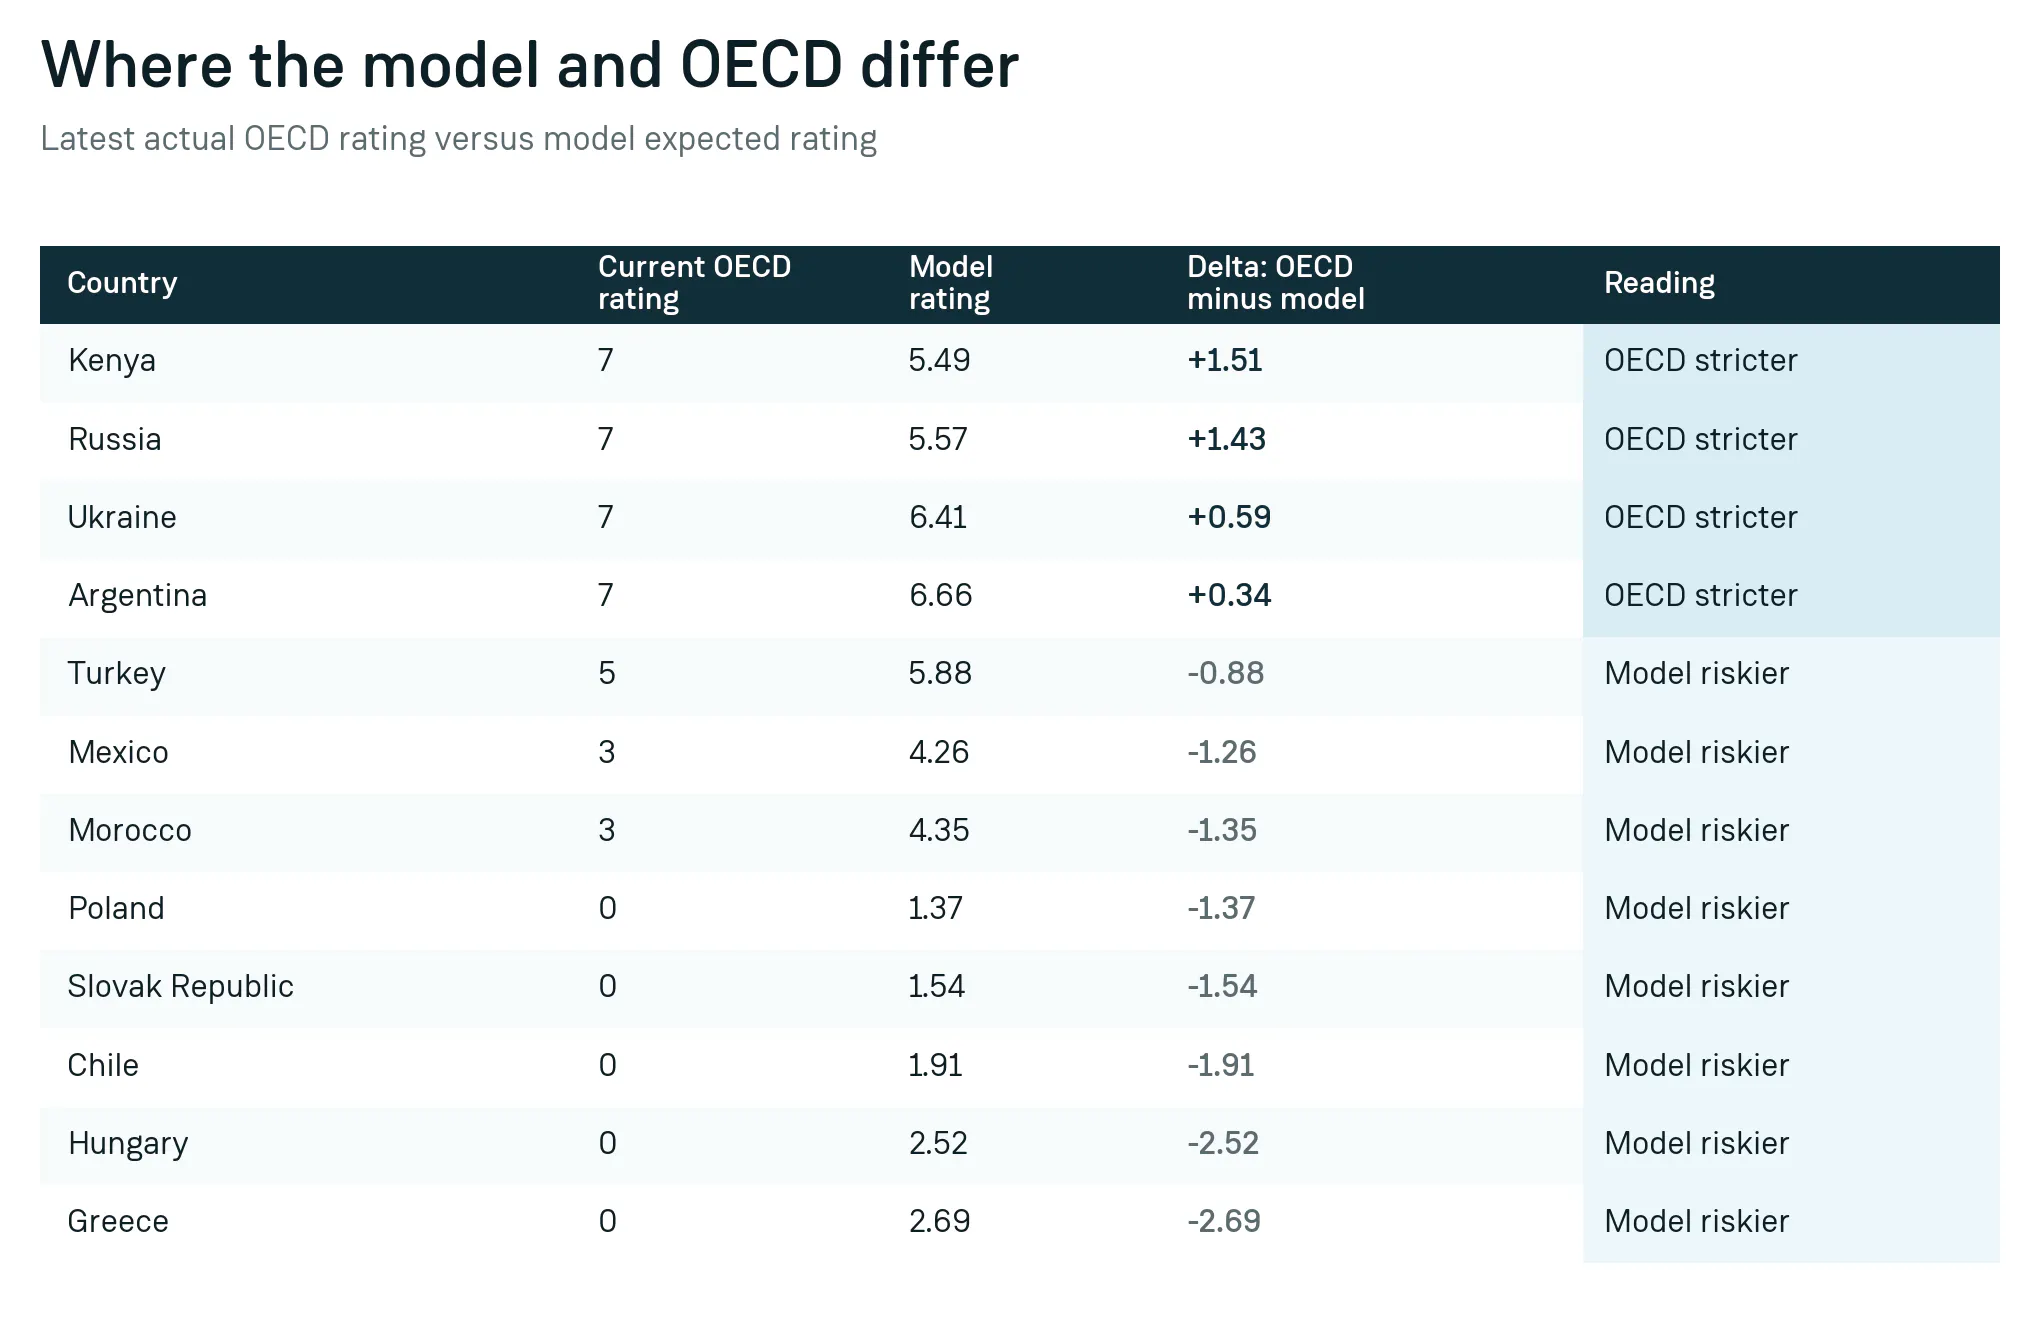
These are not "wrong" classifications. They are audit candidates. They point to cases where observable macro and governance data do not fully explain the published classification.
What We Can and Cannot Infer
The main limitation is structural: the OECD process explicitly combines quantitative model outputs with qualitative and confidential overlays by the Participants and their export credit agencies. From the outside, we observe the final classification but not the country discussion, the expert judgment, the payment-experience evidence, or the calibration choices that translate CRAM outputs into the final class. That means the model can identify deltas, but it cannot prove why those deltas exist.
Still, the largest gaps suggest plausible explanations. Russia and Ukraine are obvious cases where geopolitical risk, sanctions, war-related payment disruption, and export-credit-agency exposure management may dominate what annual macro indicators can capture. Kenya's stricter classification may reflect concerns around external financing pressure, debt-service liquidity, and market-access risk that are only partly visible in lagged annual data. Argentina's residual is smaller, but it likely reflects the interaction of macro instability, policy credibility, and payment history.
On the other side, Greece, Hungary, Chile, Poland, and the Slovak Republic are cases where the model-implied class is riskier than the actual OECD classification. All countries of the Class 0 - the one that does not "officially" exist anylonger. For several of these countries, the gap may reflect institutional anchors, regional integration, long repayment histories, high-income or EU status, and export-credit-agency payment experience that are not fully captured by the macro panel. It reminds one a bit about the sovereign credit ratings of European countries before the European debt crisis, when many countries benefitted from a sovereign rating uplift that was not "justified" by a purely quantitative model of macro-fundamentals. Mexico and Morocco may be similar in a different way: the model sees macro, governance, or external-vulnerability signals that push the expected rating higher, while the OECD classification may place more weight on payment record, policy continuity, industrial integration, or country-specific expert judgment.
The key point is that the residual should be treated as a research signal, not as a verdict. A large residual tells us where the confidential and qualitative part of the OECD process may matter most.
Bottom Line
A transparent macro model can explain a substantial share of OECD country risk classifications, but it cannot fully reproduce a process that deliberately combines quantitative signals with confidential payment experience and expert judgment. That is precisely why the exercise is useful.
The model provides a systematic benchmark for asking sharper questions: where do observable fundamentals line up with the OECD classification, where do they diverge, and which countries deserve deeper credit research because the published class contains information not visible in public macro data?